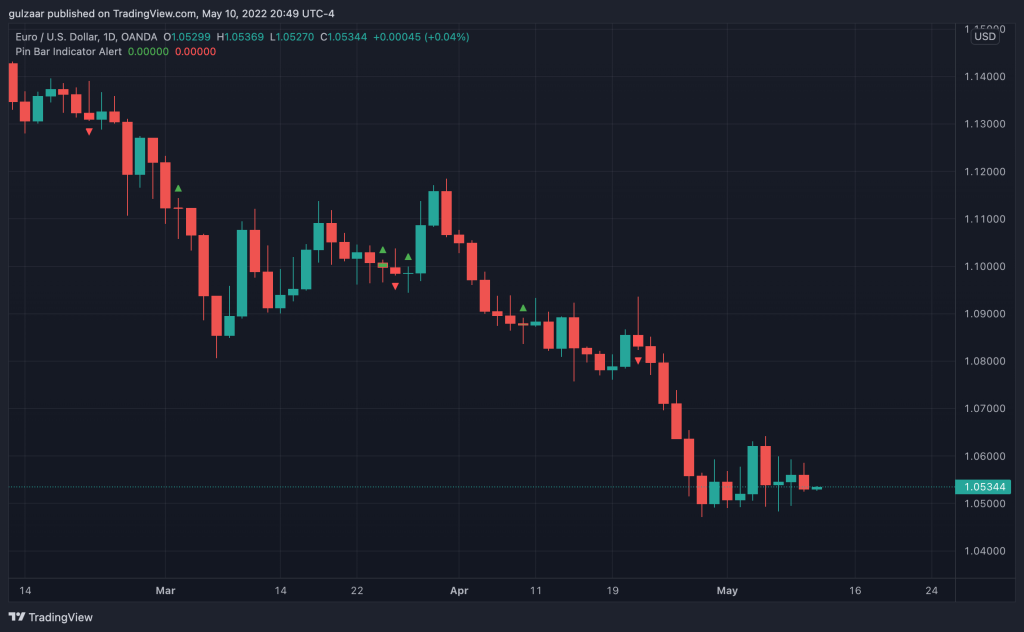
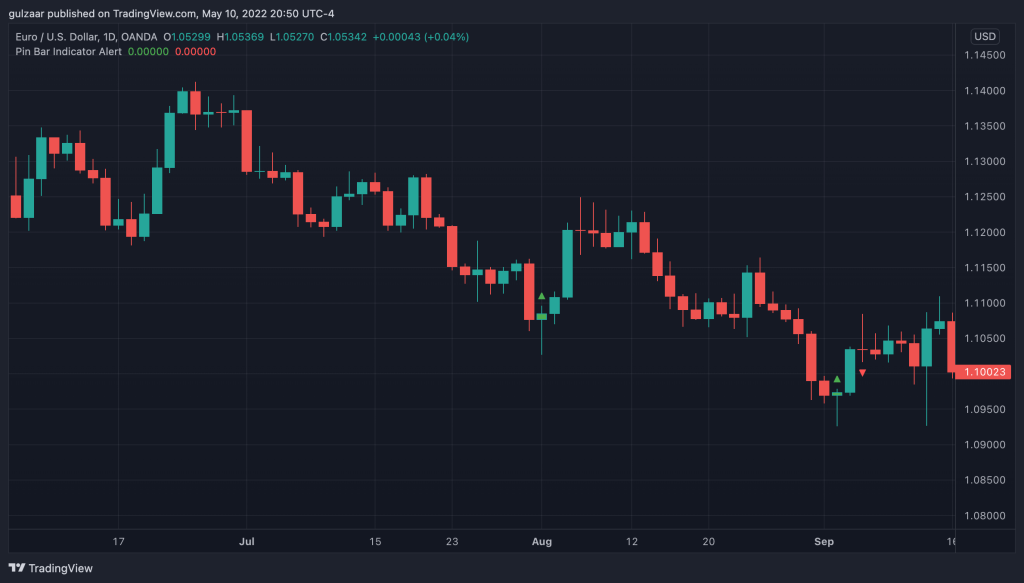
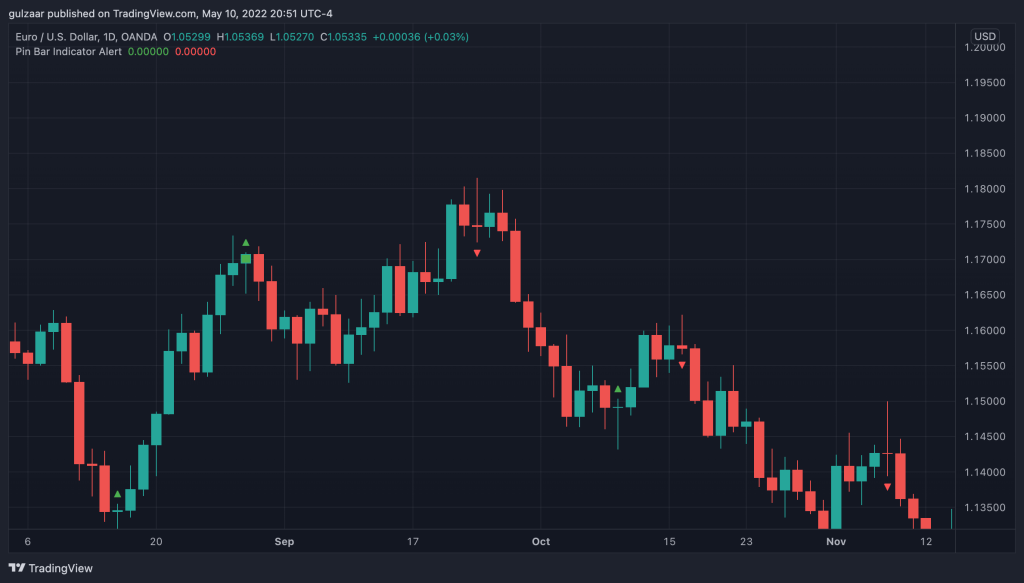
The pin bar and the hammer pattern are two classic price action trading patterns and form the cornerstone of technical analysis for many Forex traders. They form on Japanese candlestick charts and they are very strong indications of potential reversals forming in the market.
Pin bars and hammers don’t appear on any charts aside from candlestick charts, so make sure your TradingView/cTrader/MetaTrader chart is set to use candlesticks.
What’s the difference between pin bar vs hammer
A pin bar is a bearish reversal pattern, whereas a hammer is a bullish reversal pattern. You can think of these two candlestick patterns as mirror images of one another. Both pin bars and hammers have really long tails and small bodies.
A pin bar happens at or near the top of a trend and will have a very large top wick and a small body and bottom wick.
A hammer happens at or near the bottom of a trend and will have a very large bottom wick and a small body and top wick.
What pin bars and hammers tell you about price action
Pin bars and hammers are really powerful because they tell a very interesting story about price action.
Consider how they form to understand the price action behind pin bars and hammers.
How pin bars form
To recap, pin bars have long top wicks and small bodies and bottom wicks, and they usually form near resistance levels.
What happens to make a pin bar form? First, price opens near a resistance level. Buyers are in control for the beginning of the period, pushing price up and possibly beyond resistance.
However, as the time period draws to a close, sellers step in and force price all the way back down, erasing all the gains made by the buyers.
This suggests that buyers are losing steam and sellers are preparing to step in.
How hammers form
Hammers have long bottom wicks and small bodies and top wicks, and they usually form near support levels.
What happens to make a hammer form? First, price opens near a support level. Sellers are in control for the beginning of the period, pushing price down and possibly beyond support.
However, as the time period draws to a close, buyers step in and force price all the way back up, erasing all the gains made by the sellers.
This suggests that sellers are losing steam and buyers are preparing to step in.
Which timeframe should you use to trade pin bars and hammers
Pin bars and hammers can form on all timeframes ranging from the 1 minute to the Weekly and even Monthly timeframes.
Ideally, higher timeframe pin bars and hammers are indicative of stronger reversals, as they represent a much larger chunk of price action.
For example, a pin bar or hammer on the 15 minute chart suggests that the buying or selling exhaustion only occurred over a 15 minute time period.
On the other hand, a pin bar or hammer on the 4 hour chart suggests that the exhaustion occurred over a 4 hour period, meaning the exhaustion is much more significant.
How to trade pin bars and hammers
Does this mean that you should jump into a trade every time you see a pin bar and hammer?
Not quite.
While pin bars and hammers are useful chart patterns, it’s not a good idea to base your trade ideas on them alone.
Let’s take a look at how to use pin bars and hammers in your trading. Pin bars and hammers will have greater effectiveness on higher timeframes, so the bigger the timeframe you’re looking at, the stronger these indications will be.
Look for pin bars and hammers at key levels
Since pin bars are strong indications of potential reversals, look for them to form at key levels of support and resistance. These can be places where price has stopped or hesitated in the past, or they can even be pivot points or round number support and resistance areas.
Wait for a pin bar to close, then wait for one more candle to close in your direction, then take a trade with stop losses below or above the wick of the pin bar.


Using pin bars and hammers with Fibonacci levels
Pin bars and hammers can also be utilized to catch the end of retracements and pullbacks. When pin bars and hammers form at support and resistance levels that line up with strong Fibonacci levels like 50.0 or 61.8, they can indicate that the retracement is over and a continuation of the previous move is coming up.
Using pin bars and hammers with trendlines
You’ll often find pin bars and hammers form on trendlines. Pin bars on trendlines can be excellent confirmations of trend continuation.
Make sure that you’ve drawn a support trendline to follow a bullish move, and a resistance trendline to follow a bearish move!
Using pin bars and hammers with moving averages
Like trendlines, moving averages are forms of dynamic support and resistance. This type of support and resistance is called dynamic because the levels move up and down with price.
Moving averages are not as reliable as trendlines and actual support and resistance levels, but they can be a great additional confluence for a trade when a pin bar forms at or near them.
Moving averages are also of many types. Slower-period moving averages(higher numbers) will always be more reliable than faster-period moving averages.
Related: Knowing when a trend has lost momentum
Conclusion
Pin bars and hammers are more or less the same type of candlestick, except they form on opposite sides of the trend. Pin bars form at resistances, and hammers form at supports.
If you see a pin bar shaped candle form at support, it’s not an indication to buy, just as if you see a pin bar shaped candle form at resistance, it’s not an indication to sell!
