Trend trading is the best way to make significant gains in the Forex market. When you can take advantage of trends, you can ride big moves in price movement and catch hundreds of pips.
So if you’re already in a trade and want to know if the trend is still going strong or whether it is losing steam, how can you tell?
There’s a few different ways to tell.
Candle sizes
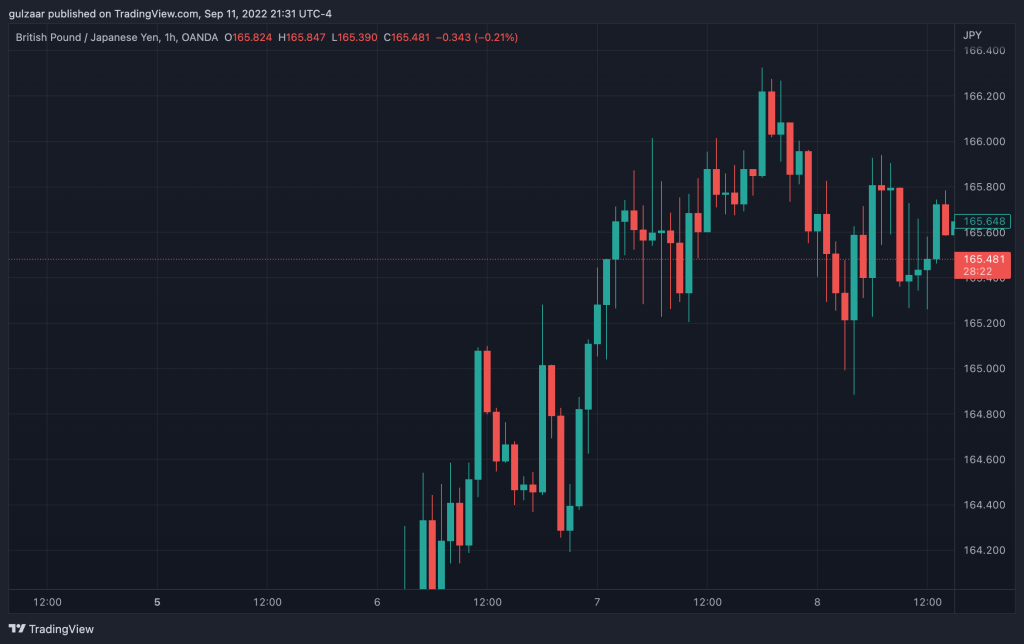
When you’re trading a trend, observing the sizes of candles can give you an idea of how strong bullish or bearish momentum is.
Typically, lots of big candles in succession suggests a strong trend. When candle sizes start getting smaller and smaller, that suggests that price is beginning to lose steam and a pullback may be on the way.
Smaller candles are no guarantee of a pullback, though, as price may just be taking a breather before it starts rising or falling again.
Price typically moves in waves, where it will move in one direction, pull back, then start moving again.
These moves are visible on smaller timeframes, but on larger timeframes, you may just see very large candles in a single direction.
For example, the one-hour or four-hour chart may show you lots of swings, but the daily chart will just show you big candles.
Distance between moving averages
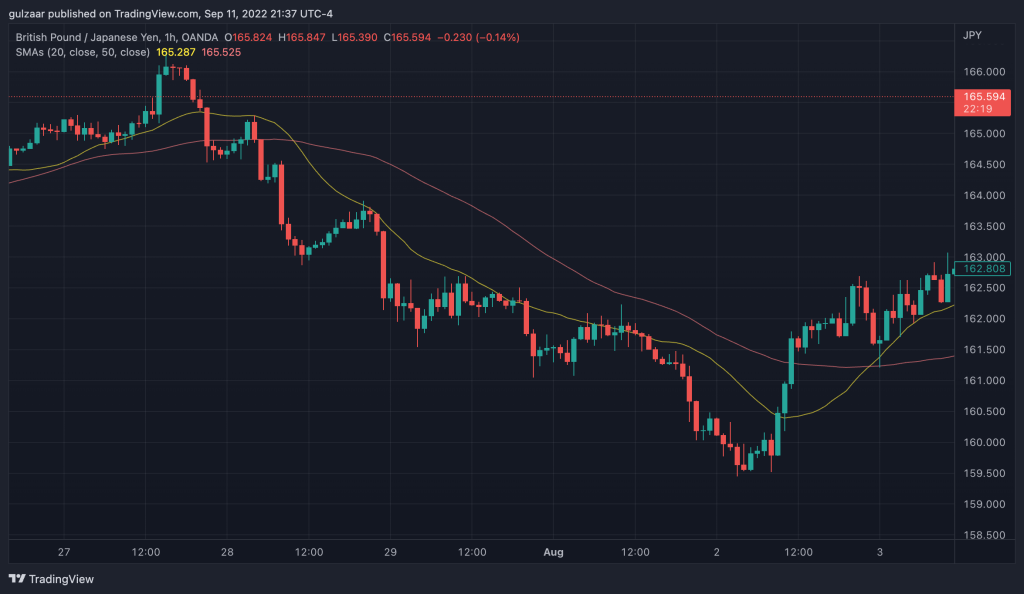
Another good way to tell whether a trend is going strong or beginning to lose steam is to use two moving averages: a fast one and a slow one.
When the gap between the fast and slow moving averages is large, it means price is going strong and the trend is in full force.
If the gap in the moving averages begins to get tighter, it means the trend is losing steam and price may start to pull back.
There’s no fixed moving average to use, but most traders use a 20 period moving average for the fast one and a 50 period moving average for the slow one.
You can then judge the gaps between the moving averages to see whether a trend is going strong or losing momentum.
Depth of pullbacks
Since price moves in waves, it’s highly unlikely that it will just skyrocket in a straight line or fall like a ton of bricks.
Trends usually take two steps forward, and one step back. Price may also move in a certain direction, then start to consolidate for some time in one area, then continue in the original direction.
Support and resistance
Price will often pull back to the last level of support or resistance that it broke.
For example, if the EUR/USD breaks 1.1000 to the upside and moves 20 pips to 1.1010, there’s a good chance that it will come back down to 1.1000 before moving back up.
As long as the pullback does not go beyond the last support or resistance, the trend is still in momentum.
If the pullback goes beyond the last broken support or resistance, the trend has lost its momentum and it’s unsure whether the last high or low will be retested or not.
Fibonacci
Many traders use Fibonacci levels to measure pullbacks.
Fibonacci levels mark out potential levels that price can pull back to using the Fibonacci ratios of 23.6, 31.2, 50.0, 61.8, and 78.6.
23.6, 31.2, and 50.0 and healthy pullbacks and there is a strong likelihood for price to retest the previous high/low and perhaps even break the level to continue further.
61.8 and 78.6 are very deep pullbacks and price may not have the momentum to continue further.
Moving averages
You can also observe that price pulls back to moving averages as a form of dynamic support and resistance.
Commonly used moving averages are the 20, 50, and 200.
Pullbacks to the 20 moving average occur in strong trends.
If price pulls back to the 50 moving average, the pressure in the opposite direction is much greater.
If price pulls back to the 200 moving average, the pressure is the opposite direction is very strong and price has returned to a “fair market” value.
From here, price can either continue back in the original direction or reverse.
Divergence
Divergence is a pattern you can see develop in oscillators like the RSI, Stochastics, and MACD indicators.
Divergence is when price is making higher highs but the oscillator is making lower highs, or the price is making lower lows but the oscillator is making higher lows..
This suggests there is not as much momentum in the trend as there was before, and a reversal could be coming up.
Divergence can also be used to see when the trend is expected to gain momentum again. This is called hidden divergence.
Hidden bullish divergence
Hidden bullish divergence is when price is making higher lows(pullbacks in the bullish move) but the oscillator is making lower lows.
This means the oscillator suggests a strong pullback, but price is making a shallower pullback, indicating that price is going to go back up.
Hidden bearish divergence
Hidden bearish divergence is when price is making lower highs(pullbacks in the bearish move) but the oscillator is making higher highs.
This means the oscillator suggests a strong pullback, but price is making a shallower pullback, indicating that price will continue back down.
Conclusion
Even though these are all good signs of understanding when a trend is losing momentum, you should never attempt to pick tops and bottoms and trade the other way.
This type of trading is almost never successful, and you’re always better off trading in the direction of the trend until a reversal is confirmed.