In technical analysis, trendlines are a very popular way to help determine price movement, the direction of the current trend, and to see when the current trend breaks and reverses into a new trend.
Many traders also consider trendlines as key support and resistance levels, though the jury is still out on that.
In this post, we’ll see whether trend lines are an effective trading strategy, how to draw trendlines, and how you can adapt them into your own trading.
The basics of Trendlines
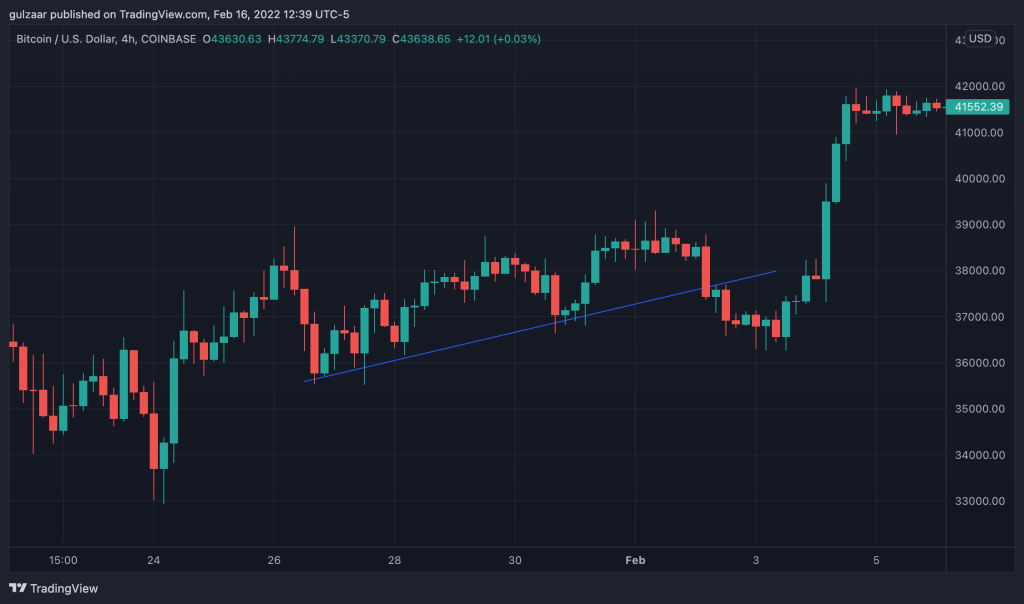
A trend line is an angled line that connects multiple highs or lows.
They are useful for determining the direction and strength of a trend, as well as seeing when the trend has broken and reversed.
Trend lines are a really simple tool to help you do better technical analysis, but they’re not reliable as a sole trigger to take trades.
Why do trend lines work?
Trend lines work because there are a lot of technical analysis traders out there in the Forex market that are seeing the same things that you are seeing!
Traders draw trendlines off of obvious highs and lows, so the more obvious the trendline is, the more likely it is that price will respect it.
You can also think of trendlines as dynamic forms of support and resistance levels: instead of the support and resistance being at a specific price, it moves up and down with the trend’s highs and lows.
Support and Resistance
Support and resistance form the basis for nearly all technical analysis.
Essentially, a support level is a price where buyers are willing to step in and start driving price movement to the upside.
A resistance level is a price where sellers are willing to step in and start driving price movement to the downside.
Horizontal levels of support and resistance are easy to understand: these are levels in an asset’s price that buyers or sellers consider to be extremes.
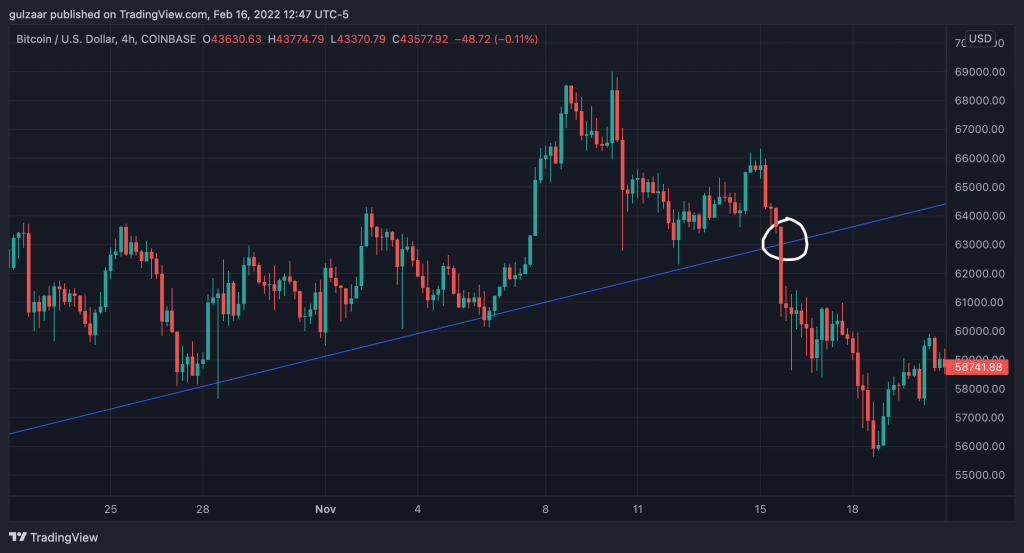
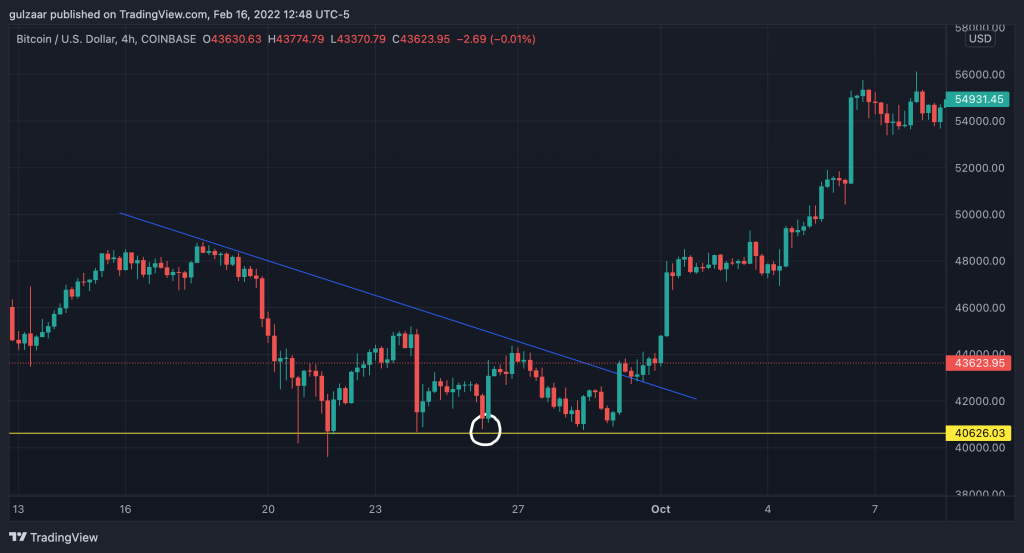
Trendlines are a little more complex. Instead of just factoring in horizontal levels, trendlines also factor in the angle at which highs and lows are created.
How does a trend work? An uptrend is when price is successively making higher highs and higher lows. This means that every time price pushes up, it goes higher than it went before. When it comes back down, it stops higher than the previous level it went down to.
A downtrend is when price is successively making lower lows and lower highs. This means that every time price pushes down, it falls lower than the previous time it fell, and when it goes back up, it stops lower than it did earlier.
You can use trendlines to help you visualize higher highs and higher lows and lower highs and lower lows.
Disclaimer: I no longer use trendlines and instead focus only on horizontal support and resistance zones. That’s not to say I don’t think trendlines work, just that they don’t fit well into my own strategy.
How reliable are trendlines?
The reliability of trendlines greatly depends on what timeframe you are studying. Trendlines that form on higher timeframes will always be more reliable than those drawn on a lower time frame.
Trendlines are fairly subjective in nature: you may be able to connect certain highs and lows and think it’s a valid trendline, and another trader may view it differently.
For this reason, I feel that trendlines are less reliable than horizontal zones of support and resistance.
Many times, you’ll see a trendline be broken only to fakeout and immediately reverse. So if you were basing your trade off of the trendline, it would be difficult to judge when to enter the trade on a bounce or a break.
Experienced traders will be able to judge a trend line much better than an inexperienced trader: because they’ve seen the same thing happen over and over again, they’ll be better able to take decisions.
The lesson to learn here is that market participants have an advantage of time: the longer you study the market, the more proficient you will become as a technical trader.
How do I draw trend lines in Forex trading?
Drawing trendlines in Forex trading is fairly straightforward.
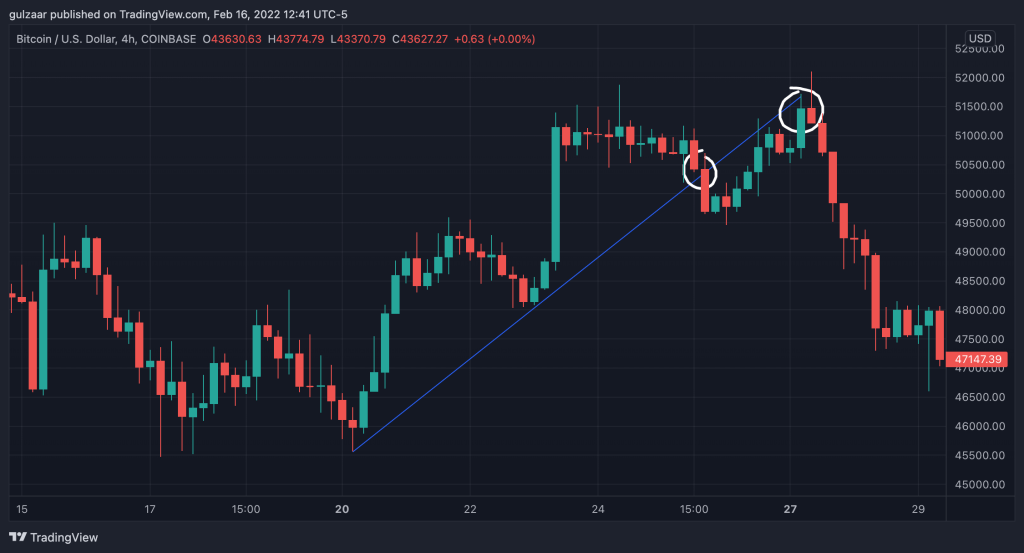
In an uptrend, look for two consecutive higher lows and draw a line connecting both of them. Extend the line further, and wait to see how price behaves when it reaches it again.
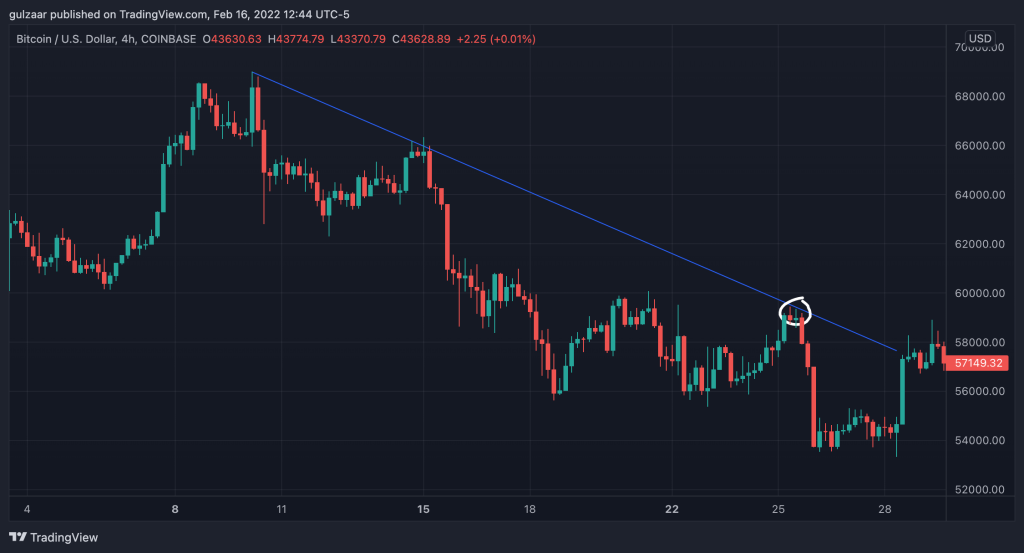
In a downtrend, look for two consecutive lower highs and draw a line connecting both of them. Extend the line further, and wait to see how price behaves when it approaches it again.
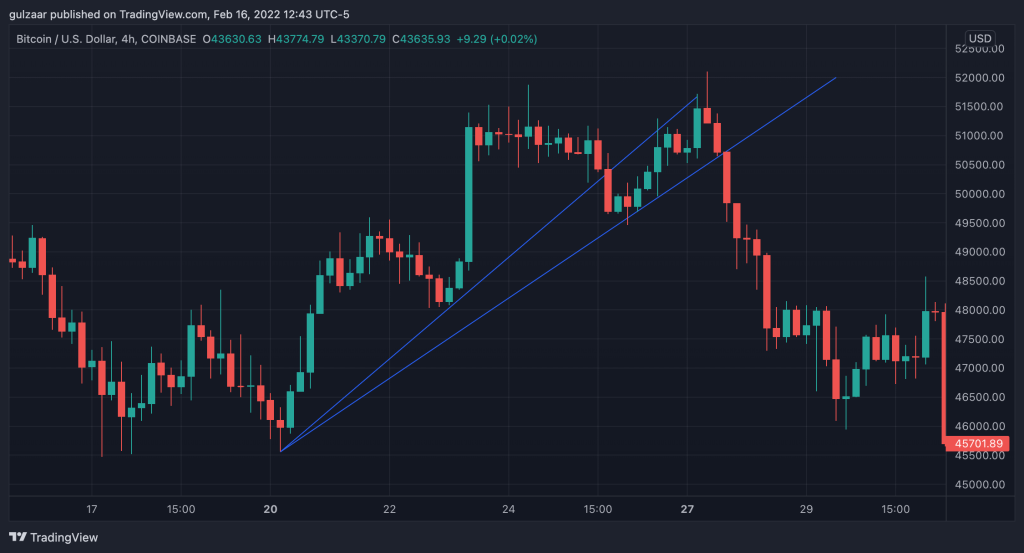
Sometimes, you’ll see price behave rather strangely and see that there are multiple ways to drawing trendlines.
That’s where the subjectivity comes in: you’ll just have to play around with the lines until you find something that you think works.
Making Decisions Off of Trendlines
So how do you trade trendlines? You can either use them to trade the same direction as the overall trend, or use them as a confirmation of trend reversal. You can also use trendlines as exit points for a trade.
Trading with the trend
Once price approaches a trendline and closes by rejecting it, you can wait for one more candle to confirm the direction price is going in and take a trade with the trend. Your stop loss would be below the low of the previous candle in an uptrend, or above the high of the previous candle in a downtrend.
Trading trend reversals
Once price breaks through a trendline, you can wait for price to retest it, reject it, and look for opportunities to go the other way.
These trend reversals are often very powerful moves, especially if taken off of higher timeframes like the 1-hour or 4-hour charts.
Using trendlines as exit points
If you’re already in a trade and you see price approaching a trendline, it’s a good time to either close part of your position to secure profits, or decrease your risk by moving your stop loss.
What to avoid when trading trendlines?
Because trendlines are so subjective, they’re much better used as a guide for judging the overall direction of the trend rather than a concrete zone of support or resistance.
Especially if you are day trading, using just a trendline can be misleading, especially if you’re drawing them on smaller timeframes.
For added confirmation, consider using one of your favorite technical indicators.
One of the riskiest things you can do is to jump into a trade the moment price touches a trend line. You need to find entry points after you have added confirmation of the trendline holding up.
Otherwise, you’re taking on significant risk and just giving your money to the markets.
Conclusion
Trendlines can be great ways to map out a downward trend or an upward trend, and when used correctly, they can help you take a profitable trade.
Just don’t make the mistake most traders do and jump in too quickly. Price action trading requires patience, so wait for the market to give you confirmation before you do anything!