Being able to read candlestick charts is an essential skill to have.
Candlestick charts provide traders with a clear visual representation of market movements, making it easier to identify trends, patterns, and potential trade opportunities.
In this article, I will teach you everything you need to know about candlestick chart analysis.
Reading a Forex Chart with Candlesticks
Before we dive into more complex candlestick patterns, let’s first understand how to read a Forex chart. A Forex chart is simply a visual representation of the price movements of a currency pair over a given time period. Candlestick charts are the most commonly used type of chart in Forex trading.
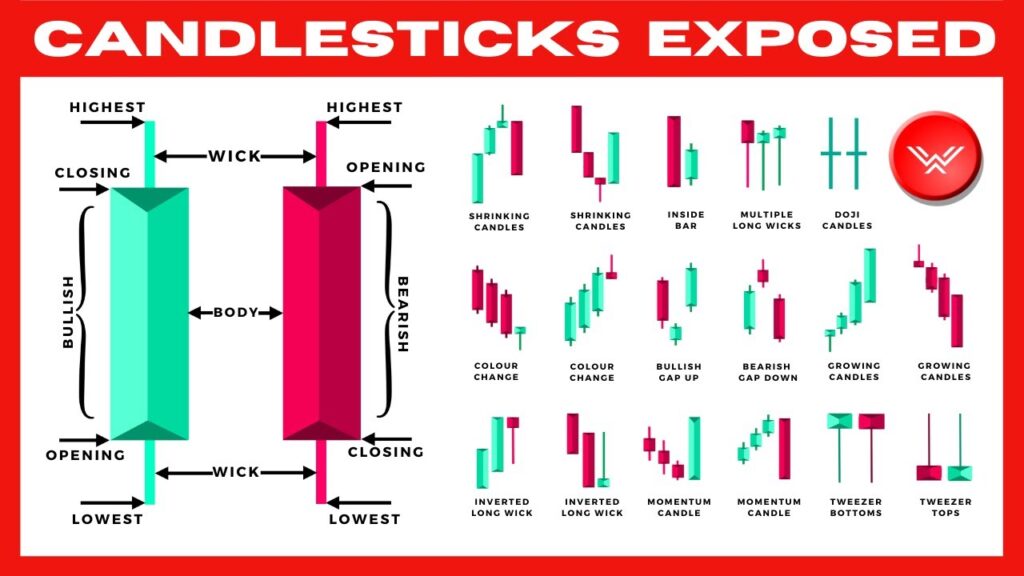
A candlestick is composed of a body and two wicks, one on the top and one on the bottom. The body represents the opening price and closing price for a given time period, while the wicks represent the highest and lowest prices reached during that same period.
A green or white candlestick typically represents a bullish candle, indicating that the price closed higher than it opened.
On the other hand, a red or black candlestick represents a bearish candle, indicating that the price closed lower than it opened.
Source: WyseTrade/Youtube
Japanese Candlestick Charts: History and Basic Formations
Candlestick charts originated in Japan in the 18th century, where rice traders used them to track market movements. Steve Nison is credited with introducing candlestick charts to the Western world in the 1980s, and they have since become the most widely used chart type in Forex trading.
There are several basic candlestick formations that you should be familiar with when learning how to read Forex candlestick charts.
The most basic formation is the doji, which has a small body and no wicks. A doji candlestick represents a period of indecision in the market, where neither the buyers nor the sellers have been able to gain the upper hand.
Other basic candlestick formations include the spinning top, hammer, hanging man, bullish, and bearish, engulfing patterns.
We’ll cover these in more detail in the following sections.
Candlestick Basics: Time and Direction
When reading Forex candlestick charts, it’s important to keep in mind that each candlestick represents a specific time period. The length of each candlestick depends on the timeframe you are looking at. For example, if you are looking at a daily chart, each candlestick represents one day’s worth of price action.
The direction of the candlestick (bullish or bearish) indicates whether the buyers or sellers were in control during that time period. If a candlestick is bullish, it means that the buyers were in control and pushed the price higher. If a candlestick is bearish, it means that the sellers were in control and pushed the price lower.
Bullish vs. Bearish Candles
As mentioned earlier, a bullish candlestick represents a period where the buyers were in control and pushed the price higher, while a bearish candlestick represents a period where the sellers were in control and pushed the price lower.
Bullish candles are characterized by a long body and a shorter wick on the top and bottom, indicating that the buyers were able to maintain control throughout the period.
Bearish candles, on the other hand, are characterized by a long body and a shorter wick on the top and bottom, indicating that the sellers were able to maintain control throughout the period.
Bullish Candlesticks
There are several bullish candlestick patterns that you should be familiar with as a Forex trader. These patterns indicate that the buyers are gaining momentum and that there may be further upside potential in the market.
One such pattern is the hammer, which has a small body and a long wick on the bottom. This pattern indicates that the buyers were able to push the price higher after an initial sell-off, and that there may be further buying opportunities in the market.
Another bullish pattern is the morning star, which is formed by a long bearish candlestick, followed by a small doji or spinning top, and then a long bullish candlestick. This pattern indicates that the sellers were in control but that the buyers have regained control and that there may be a trend reversal.
Bearish Candlesticks
Just as there are bullish candlestick patterns, there are also bearish candlestick patterns that traders should be aware of. These patterns indicate that the sellers are gaining momentum, and that there may be further downside potential in the market.
One bearish pattern is the shooting star, which has a small body and a long wick on the top. This pattern indicates that the sellers were able to push the price lower after an initial rally and that there may be further selling opportunities in the market.
Another bearish pattern is the evening star, which is formed by a long bullish candlestick, followed by a small doji or spinning top, and then a long bearish candlestick. This pattern indicates that the buyers were in control, but that the sellers have regained control, and that there may be a trend reversal.
Candlestick Chart Reading Like a Pro
To read Forex candlestick charts like a pro, you need to be able to identify and interpret common candlestick patterns. These patterns can help you identify potential trade opportunities and can also provide insight into market trends.
What Common Candlestick Patterns Mean
Some of the most common candlestick patterns in Forex trading include the doji, hammers, hanging men, spinning tops, engulfing patterns, shooting stars, morning and evening stars, head and shoulders, double tops and bottoms, 1-2-3 patterns, flags and pennants, and triangles.
Doji Candlestick Pattern
As mentioned earlier, a doji candlestick represents a period of indecision in the market, where neither the buyers nor the sellers have been able to gain the upper hand. A doji candlestick can indicate that the market is about to change direction, or that a trend is about to reverse.
Hammers and Hanging Men
Hammers and hanging men are bullish candlestick patterns that indicate potential buying opportunities in the market. A hammer has a small body and a long wick on the bottom, while a hanging man has a small body and a long wick on the top.
A hammer indicates that the buyers were able to push the price higher after an initial sell-off, while a hanging man indicates that the sellers were able to push the price lower after an initial rally.
Spinning Top Candlestick Pattern
A spinning top candlestick has a small body and two long wicks, indicating that the buyers and sellers were evenly matched during the period. This pattern can indicate a period of indecision in the market, and can also signal a potential trend reversal.
Engulfing Patterns
Engulfing patterns are formed when a small candlestick is followed by a larger candlestick that “engulfs” the first candlestick. A bullish engulfing pattern is formed when a small bearish candlestick is followed by a larger bullish candlestick, indicating that the buyers are gaining momentum. A bearish engulfing pattern is formed when a small bullish candlestick is followed by a larger bearish candlestick, indicating that the sellers are gaining momentum.
Shooting Star
A shooting star is a bearish candlestick pattern that has a small body and a long wick on the top, indicating that the sellers were able to push the price lower after an initial rally. This pattern can indicate a potential trend reversal and can also signal a potential selling opportunity.
Morning and Evening Star Candlestick Patterns
Morning and evening star candlestick patterns are formed by a series of three candlesticks. A morning star pattern is formed by a long bearish candlestick, followed by a small doji or spinning top, and then a long bullish candlestick. This pattern indicates that the sellers were in control but that the buyers have regained control and that there may be a trend reversal.
An evening star pattern is formed by a long bullish candlestick, followed by a small doji or spinning top, and then a long bearish candlestick. This pattern indicates that the buyers were in control but that the sellers have regained control and that there may be a trend reversal.
Head and Shoulders
A head and shoulders pattern is a bearish reversal pattern that is formed by a series of three peaks, with the middle peak being the highest. This pattern can indicate that the buyers are losing momentum and that the sellers are gaining control.
Double Tops and Bottoms
Double tops and bottoms are reversal patterns that are formed when the price reaches a certain level twice before reversing. A double top is formed when the price reaches a certain level twice before reversing lower, while a double bottom is formed when the price reaches a certain level twice before reversing higher. These patterns can indicate that the market is about to change direction.
1-2-3 Patterns
1-2-3 patterns are reversal patterns that are formed by a series of three peaks or valleys. A bullish 1-2-3 pattern is formed by a low, followed by a lower low, and then a higher low. A bearish 1-2-3 pattern is formed by a high, followed by a higher high, and then a lower high.
Flags and Pennants
Flags and pennants are continuation patterns that are formed when the price moves in a tight range after a sharp move. A flag is formed when the price movement in the range is rectangular, while a pennant is formed when the range is triangular. These patterns can indicate that the market is taking a breather before continuing in the same direction.
Triangles
Triangles are continuation patterns that are formed when the price moves in a tight range, with the highs and lows forming converging trend lines. A bullish triangle is formed when the trend lines are moving up, while a bearish triangle is formed when the trend lines are moving down. These patterns can indicate that the market is taking a breather before continuing in the same direction.
Combining Technical Analysis Indicators with Candlestick Patterns
While candlestick patterns can provide valuable insights into market movements, they are even more powerful when used in combination with other technical analysis indicators. Some common indicators used in conjunction with candlestick patterns include moving averages, relative strength index (RSI), and stochastic oscillator.
Moving averages can help identify the overall trend in the market, while RSI and stochastic oscillator can help identify potential buying or selling opportunities.
Conclusion
Learning how to read Forex candlestick charts is an essential skill for any trader. Candlestick charts provide a clear visual representation of market movements, making it easier to identify trends, patterns, and potential trade opportunities.
By familiarizing yourself with common candlestick patterns, you can gain valuable insights into market movements and potentially profit from them. And by combining candlestick patterns with other technical analysis indicators, you can further improve your trading skills and increase your chances of success in the Forex market.
FAQ
Here are some frequently asked questions about reading Forex candlestick charts
What is a candlestick chart?
A candlestick chart is a type of chart used in Forex trading that provides a visual representation of price movements for a given currency pair over a specific time period.
What do the different colors of candlesticks represent?
Green or white candlesticks represent bullish candles, indicating that the price closed higher than it opened. Red or black candlesticks represent bearish candles, indicating that the price closed lower than it opened.
What are some common bullish candlestick patterns?
Common bullish candlestick patterns include the hammer, morning star, and bullish engulfing pattern.
What are some common bearish candlestick patterns?
Common bearish candlestick patterns include the shooting star, evening star, and bearish engulfing pattern.
What is the significance of the wicks on a candlestick?
The wicks on a candlestick represent the highest and lowest prices reached during a given time period. They can provide valuable information about market sentiment and potential support and resistance levels.
How do I use candlestick patterns in my trading strategy?
Candlestick patterns can provide valuable insights into market movements and potential trade opportunities. They are even more powerful when used in conjunction with other technical analysis indicators, such as moving averages, RSI, and stochastic oscillator.
How long should I look at a candlestick chart?
The length of time you should look at a candlestick chart depends on your trading style and strategy. Some traders prefer to look at charts on a daily basis, while others prefer shorter timeframes such as hourly or even minutes.
How do I know which candlestick patterns to look for?
It’s important to familiarize yourself with common candlestick patterns and their meanings. Look for patterns that fit with your trading strategy and be sure to take into account other technical analysis indicators when making trading decisions.