As a forex trader, I have had years of experience studying and trading the various patterns that occur in the forex market. Patterns refer to the recurring formations that occur on price charts, and traders use them to analyze market behavior and identify potential trade opportunities.
There are many different types of patterns, each with its own unique characteristics and significance. In this article, I will focus on the most commonly used forex chart patterns and how they can be used to improve your trading performance.
What are patterns in forex?
Patterns in forex refer to the recurring formations that occur on price charts. They are created by the movements of price over time and are a reflection of market sentiment and behavior.
Patterns are formed as a result of the interaction between buyers and sellers in the market, and they can be used to analyze the psychology of the market participants. By studying patterns, traders can gain insights into the direction of price movements and identify potential trading opportunities.
Types of patterns
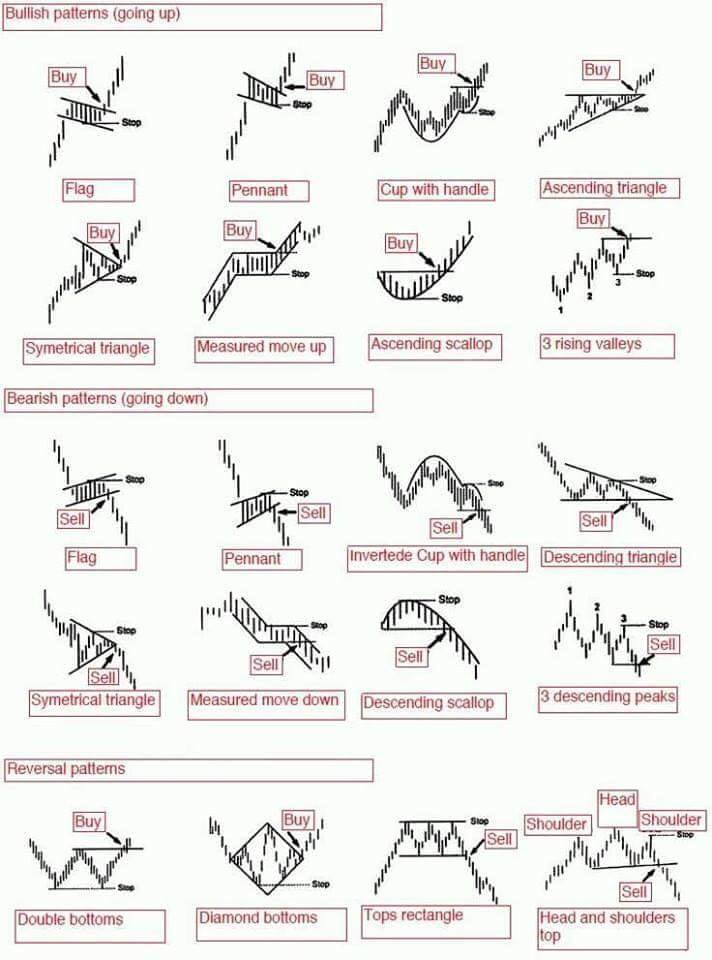
There are many different types of patterns that occur in the forex market, but they can be broadly categorized into two types – continuation patterns and reversal patterns.
Continuation patterns indicate that the current trend is likely to continue, while reversal patterns suggest that the trend is about to reverse.
Continuation patterns include flags, pennants, wedges, and rectangles. These patterns typically occur during a trend and indicate that the market is taking a breather before continuing in the same direction.
Reversal patterns include head and shoulders, double tops and bottoms, and triangles. These patterns typically occur at the end of a trend and suggest that the market is about to reverse direction.
3 most common and effective candlestick patterns
Candlestick patterns are one of the most widely used methods of analyzing patterns in forex. They are created by the movement of price over time and are a reflection of market sentiment and behavior. The three most common and effective candlestick patterns are the doji, engulfing pattern, and hammer.
Doji pattern
The doji pattern occurs when the open and close of a candlestick are the same or very close to each other. It is a sign of indecision in the market and suggests that buyers and sellers are evenly matched. The doji pattern can be a signal of a potential trend reversal or a continuation of the current trend.
Engulfing pattern
The engulfing pattern occurs when a small candlestick is followed by a larger one that completely engulfs the previous one.
It is a sign of a potential trend reversal and suggests that the buyers or sellers have taken control of the market. The engulfing pattern can be a signal of a potential change in trend direction.
Hammer pattern
The hammer pattern occurs when the price opens and then drops significantly during the day, only to recover and close near the open.
It is a sign of a potential trend reversal and suggests buyers have entered the market and are pushing higher prices. The hammer pattern can be a signal of a potential change in trend direction.
Triangle chart pattern
The triangle chart pattern is a continuation pattern that is formed by two converging trendlines. The triangle pattern is formed when the price makes higher lows and lower highs, indicating a period of consolidation before the continuation of the trend.
There are three types of triangle patterns: ascending, descending, and symmetrical.
The ascending triangle pattern occurs when the price makes higher lows and is capped by a horizontal resistance level. This pattern is considered bullish and suggests that the market is likely to continue in an upward direction.
The descending triangle pattern occurs when the price is making lower highs and is supported by a horizontal support level. This pattern is considered bearish and suggests that the market is likely to continue in a downward direction.
The symmetrical triangle pattern occurs when the price is making both higher lows and lower highs and the trendlines converge towards each other. This pattern is considered neutral and suggests that the market is in a period of consolidation before the continuation of the trend.
Traders can look for a breakout from the triangle pattern as a signal of a continuation of the trend. A breakout to the upside from an ascending triangle pattern or to the downside from a descending triangle pattern can be a signal of a potential trade opportunity.
Double Top chart pattern
The double top chart pattern is a reversal pattern that is formed by two peaks that are roughly equal in height, with a trough in between. The double top pattern is a sign that the uptrend may be coming to an end and that a reversal to a downtrend may be on the horizon.
The double top pattern can be confirmed by a break below the trough between the two peaks, which suggests that the bears have taken control of the market. Traders can look for a potential short trade opportunity after the confirmation of the double top pattern.
Double Bottom chart pattern
The double bottom chart pattern is the opposite of the double top pattern and is a reversal pattern formed by two troughs roughly equal in depth, with a peak in between.
The double bottom pattern is a sign that the downtrend may be coming to an end and that a reversal to an uptrend may be on the horizon.
The double bottom pattern can be confirmed by a break above the peak between the two troughs, which suggests that the bulls have taken control of the market. Traders can look for a potential long trade opportunity after the confirmation of the double bottom pattern.
Triple Top chart pattern
The triple top chart pattern is a reversal pattern that is formed by three peaks that are roughly equal in height, with two troughs in between. The triple top pattern is a sign that the uptrend may be coming to an end and that a reversal to a downtrend may be on the horizon.
The triple top pattern can be confirmed by a break below the lowest trough between the three peaks, which suggests that the bears have taken control of the market. Traders can look for a potential short trade opportunity after the confirmation of the triple top pattern.
Triple Bottom chart pattern
The triple bottom chart pattern is the opposite of the triple top pattern and is a reversal pattern formed by three troughs roughly equal in depth, with two peaks in between.
The triple bottom pattern is a sign that the downtrend may be coming to an end and that a reversal to an uptrend may be on the horizon.
The triple bottom pattern can be confirmed by a break above the highest peak between the three troughs, which suggests that the bulls have taken control of the market. Traders can look for a potential long trade opportunity after the confirmation of the triple bottom pattern.
Head and Shoulders chart pattern
The head and shoulders chart pattern is a reversal pattern formed by three peaks, with the middle peak being the highest and the two outer peaks roughly equal in height. The head and shoulders pattern is a sign that the uptrend may be coming to an end and that a reversal to a downtrend may be on the horizon.
The head and shoulders pattern can be confirmed by a break below the neckline that connects the two troughs between the outer peaks and the head. Traders can look for a potential short trade opportunity after the confirmation of the head and shoulders pattern.
Inverse Head and Shoulders chart pattern
The inverse head and shoulders chart pattern is the opposite of the head and shoulders pattern and is a reversal pattern that is formed by three troughs, with the middle trough being the deepest and the two outer troughs being roughly equal in depth. The inverse head and shoulders pattern is a sign that the downtrend may be coming to an end and that a reversal to an uptrend may be on the horizon.
The inverse head and shoulders pattern can be confirmed by a break above the neckline that connects the two peaks between the outer troughs and the head. Traders can look for a potential long trade opportunity after the confirmation of the inverse head and shoulders pattern.
Wedge chart pattern
The wedge chart pattern is a continuation pattern that is formed by two converging trendlines that are slanted in the same direction.
The wedge pattern is formed when the price is making higher lows and higher highs, indicating a period of consolidation before the continuation of the trend. There are two types of wedge patterns – rising wedge and falling wedge.
The rising wedge pattern occurs when the price is making higher highs and is capped by a downward sloping resistance line. This pattern is considered bearish and suggests that the market is likely to continue in a downward direction.
The falling wedge pattern occurs when the price is making lower lows and is supported by an upward sloping support line. This pattern is considered bullish and suggests that the market is likely to continue in an upward direction.
Flag chart pattern
The flag chart pattern is a continuation pattern that is formed by a sharp price movement followed by a period of consolidation. The flag pattern is formed when the price is making a sharp move up or down and then enters a period of consolidation before continuing in the same direction.
The flag pattern is characterized by a small rectangle that forms during the consolidation period, with two trendlines that are parallel to each other. Traders can look for a breakout from the flag pattern as a signal of a continuation of the trend.
Pennant chart pattern
The pennant chart pattern is similar to the flag pattern and is a continuation pattern that is formed by a sharp price movement followed by a period of consolidation. The pennant pattern is formed when the price is making a sharp move up or down and then enters a period of consolidation before continuing in the same direction.
The pennant pattern is characterized by a small triangle that forms during the consolidation period, with two trendlines that are converging towards each other. Traders can look for a breakout from the pennant pattern as a signal of a continuation of the trend.
Broadening Formation pattern (megaphone pattern)
The broadening formation pattern, also known as the megaphone pattern, is a reversal pattern that is formed by two diverging trendlines that are expanding in opposite directions. The broadening formation pattern is formed when the price is making higher highs and lower lows, indicating a period of volatility and uncertainty in the market.
The broadening formation pattern is considered bearish and suggests that the market is likely to reverse direction. Traders can look for a potential short trade opportunity after the confirmation of the broadening formation pattern.
Diamond chart pattern
The diamond chart pattern is a reversal pattern that is formed by two converging trendlines that are slanted in opposite directions. The diamond pattern is formed when the price is making higher highs and lower lows, indicating a period of consolidation before the reversal of the trend.
The diamond pattern is characterized by a diamond-shaped figure that forms during the consolidation period. Traders can look for a potential trade opportunity after the confirmation of the diamond pattern.
Spike pattern
The spike pattern is a reversal pattern that is formed by a sudden and sharp move in price that is followed by a period of consolidation. The spike pattern is characterized by a long candlestick that has a small body and a long wick or shadow.
The spike pattern can be a sign of a potential trend reversal and can be confirmed by a break below the consolidation period. Traders can look for a potential trade opportunity after the confirmation of the spike pattern.
Volume candlestick patterns
The volume candlestick pattern is a reversal pattern that is characterized by a large candlestick with a high trading volume. The volume candlestick pattern is a sign that there is significant buying or selling pressure in the market.
The volume candlestick pattern can be a sign of a potential trend reversal and can be confirmed by a break above or below the consolidation period. Traders can look for a potential trade opportunity after the confirmation of the volume candlestick pattern.
Tower chart pattern
The tower chart pattern is a continuation pattern that is characterized by a series of candlesticks that are all the same color and have a long body. The tower pattern is a sign that there is significant momentum in the market.
The tower pattern can be a signal of a potential trade opportunity as it suggests that the trend is likely to continue in the same direction. Traders can look for a potential trade opportunity after the confirmation of the tower pattern.
Three Crows pattern (Three Buddhas)
The three crows pattern, also known as the three buddhas pattern, is a reversal pattern that is formed by three long and bearish candlesticks. The three crows pattern is a sign that the bulls are losing control of the market and that a reversal to a downtrend may be on the horizon.
The three crows pattern can be confirmed by a break below the lowest point of the three candlesticks. Traders can look for a potential short trade opportunity after the confirmation of the three crows pattern.
Cube pattern (Golden Cube)
The cube pattern, also known as the golden cube pattern, is a reversal pattern that is formed by a series of candlesticks that alternate between bullish and bearish. The cube pattern is a sign that the market is in a period of consolidation before the reversal of the trend.
The cube pattern is characterized by a cube-shaped figure that forms during the consolidation period. Traders can look for a potential trade opportunity after the confirmation of the cube pattern.
Tweezers pattern
The tweezers pattern is a reversal pattern formed by two candlesticks with the same high or low. The tweezers pattern is a sign that the market is in a period of indecision and that a reversal to the trend may be on the horizon.
The tweezers pattern can be confirmed by a break above or below the consolidation period. Traders can look for a potential trade opportunity after the confirmation of the tweezers pattern.
Gap pattern (Gapping play)
The gap pattern, also known as the gapping play pattern, is a continuation pattern that is formed by a gap in the price chart. The gap pattern is a sign that there is significant momentum in the market.
The gap pattern can be a signal of a potential trade opportunity as it suggests that the trend is likely to continue in the same direction. Traders can look for a potential trade opportunity after the confirmation of the gap pattern.
Mount pattern
The mount pattern is a reversal pattern that is formed by a series of candlesticks that resemble a mountain. The mount pattern is a sign that the market is in a period of consolidation before the reversal of the trend.
The mount pattern can be confirmed by a break below the lowest point of the mountain. Traders can look for a potential short trade opportunity after the confirmation of the mount pattern.
Symmetrical Channel pattern
The symmetrical channel pattern is a continuation pattern that is formed by two parallel trendlines that are slanted in the same direction. The symmetrical channel pattern is formed when the price is making higher lows and higher highs, indicating a period of consolidation before the continuation of the trend.
The symmetrical channel pattern can be a signal of a potential trade opportunity as it suggests that the trend is likely to continue in the same direction. Traders can look for a potential trade opportunity after the breakout from the symmetrical channel pattern.
Three Stair Steps pattern
The three stair steps pattern is a continuation pattern that is formed by a series of candlesticks that resemble a set of stairs. The three stair steps pattern is a sign that there is significant momentum in the market.
The three stair steps pattern can be a signal of a potential trade opportunity as it suggests that the trend is likely to continue in the same direction. Traders can look for a potential trade opportunity after the confirmation of the three stair steps pattern.
Flat Breakout pattern
The flat breakout pattern is a continuation pattern that is formed by a period of consolidation followed by a sharp breakout in price. The flat breakout pattern is a sign that there is significant momentum in the market.
The flat breakout pattern can be a signal of a potential trade opportunity as it suggests that the trend is likely to continue in the same direction. Traders can look for a potential trade opportunity after the confirmation of the flat breakout pattern.
Patterns for Cryptocurrency trading
Many of the patterns discussed in this article can also be applied to cryptocurrency trading. Cryptocurrencies are highly volatile and can experience significant price movements in a short period of time. As such, it is important for cryptocurrency traders to be aware of chart patterns and to use them as a tool for analyzing the market.
Traders should be aware that chart patterns are not always accurate and that there is no guarantee that a pattern will result in a successful trade.
Traders should also be aware of the risks involved in trading cryptocurrencies and only trade with money they can afford to lose.
Conclusion
In conclusion, chart patterns are an important tool for forex and cryptocurrency traders. By identifying chart patterns, traders can gain insight into the market and make informed trading decisions. While chart patterns are not always accurate, they can be a useful tool for traders who are looking to improve their trading strategies.
Traders should also be aware of the risks involved in trading and should always use proper risk management techniques. With proper analysis and risk management, chart patterns can be a valuable tool for traders who are looking to improve their trading performance.