Support and resistance are the most important ideas in forex trading using technical analysis. Support and resistance levels form the basis for nearly all trading strategies.
So how do you identify support and resistance levels, and how do you draw support and resistance?
What are support and resistance levels
Support and resistance levels are specific price points or zones where there is increased selling pressure or buying pressure.
An area of support is an area where buyers are potentially waiting to push price back up, and the opposite is true for an area of resistance: it is an area where sellers are waiting to push price back down.
Essentially, support and resistance levels are areas where price stopped moving in the direction it was going in.
Support and resistance levels can be found at any price point, though they can also be found at round number areas.
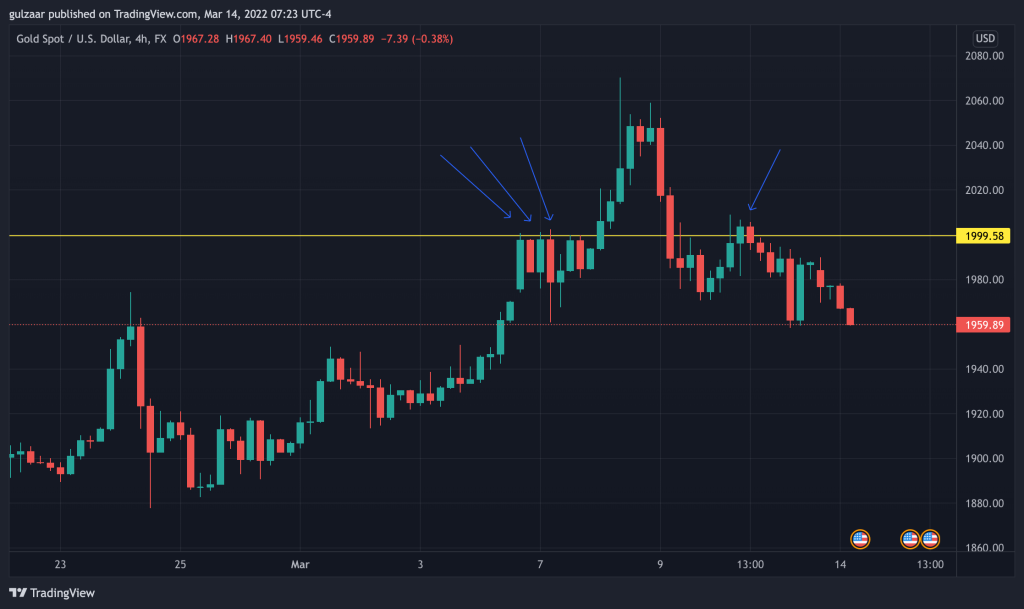
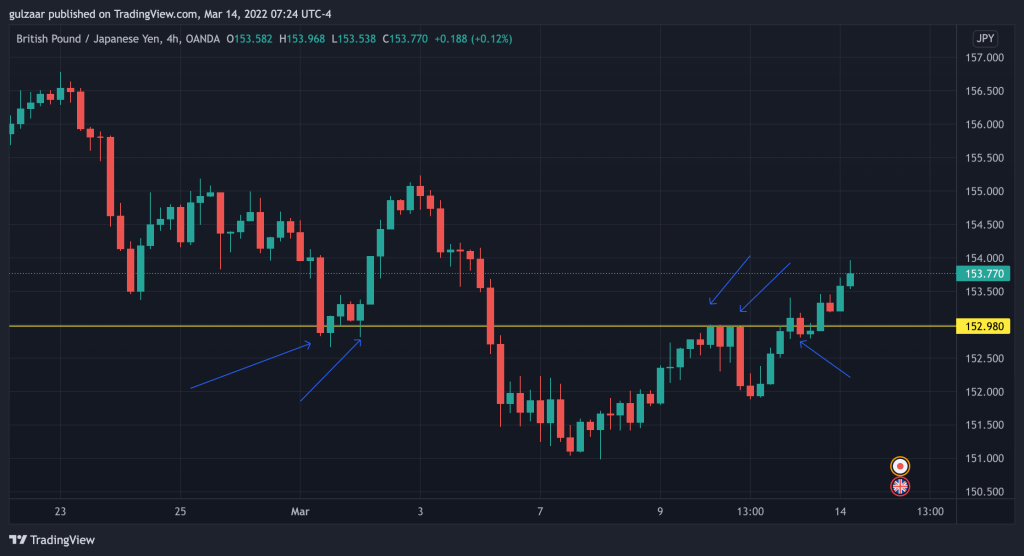
When price tests a resistance, two things can happen: either sellers step in again and push price back down, or buyers take charge and price breaks through the resistance level.
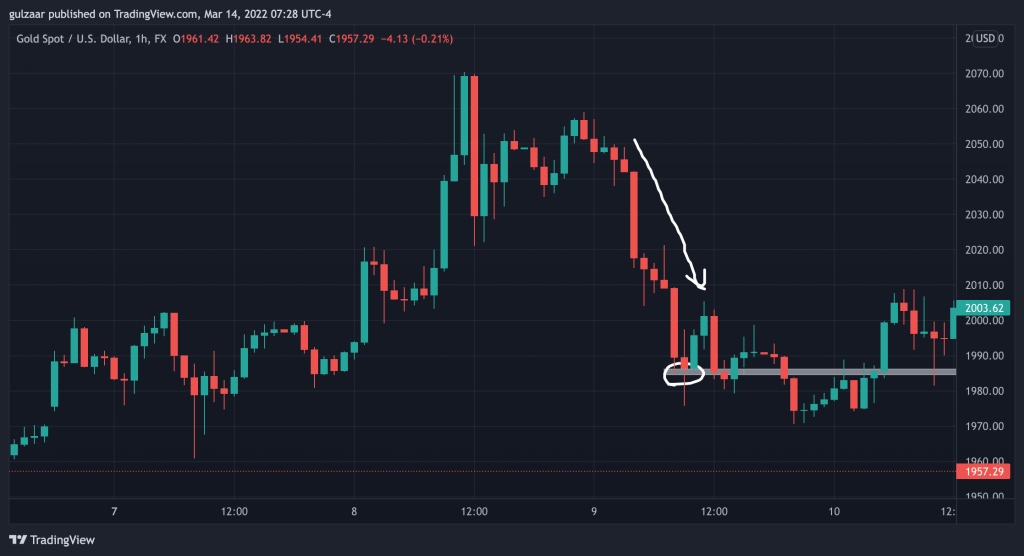
In order for the break to be considered valid, price must either continue pushing further up, or fall down a little, retest the resistance(now as support), then push back up.
The opposite is true for support levels. Instead of sellers waiting for price to reach a level, here, it will be buyers.
Think of support and resistance levels as zones
A common mistake that many beginner traders make is that they try to pinpoint support and resistance levels as exact points on the chart.
The problem with this is that support and resistance levels are subjective to a certain degree. The only reason these levels hold up is because other traders out there are seeing the same thing on their charts!
So imagine there are thousands of traders worldwide all looking at the charts and seeing something in common, then choosing to act upon it.
The area where theere can be slight differences is if one trader sees the wick of a candle at 1.3001, and the other trader sees it at 1.3003!
Instead of considering support and resistance levels as exact points on a chart, you should think of them as zones.
That means there is some wiggle room of a few pips in support and resistance zones. In some cases, price may move to respect the exact area it wicked to some time in the past, but in other cases, it may under or overshoot.
Understanding this will help prevent you from jumping into trades too early or missing a trade because you were waiting for price to reach an exact point.
Support and resistance levels are created dynamically
Support and resistance zones are created as price moves. If price is moving up, you will see a series of bullish candles. Once a single candle turns bearish, that means a resistance has formed.
The same thing works for supports.
When price is moving down and there are a series of bearish candles, a bullish candle forming indicates a support has formed.
High time frame vs low time frame zones
A key factor for learning how to draw support and resistance and understanding how support and resistance zones work in general is to know how the time frame you are trading off of affects the support or resistance level.
For example, a support or resistance level on a higher time frame like the Daily or 4H will be much stronger than a support or resistance level on a shorter time frame like a M15 or M5 chart.
One of the easiest ways to identify a strong price level vs a weak price level is to just zoom out on the chart to a higher time frame and start your analysis from there.
So when you come to the charts, start at the weekly or daily chart and work your way down from there.
Identify major daily zones, then go down to the H4 chart and adjust your zone accordingly.
Then go down to the H1 chart and adjust your zone again.
I generally stop adjusting after I reach H1 or M30, but if your trading strategy allows for it, you can even go down to the M15 or M5 charts as well.
You can also draw a horizontal line for all major support and resistance zones on every time frame.
So when you finally open your H1 or M30 chart to trade off of, you’ll be able to see Weekly, Daily, and 4-Hour zones.
Related:
How to trade without indicators
How to draw support and resistance levels
Depending on the trading platform you use, there a few ways you can draw support and resistance levels. Two of the most popular trading platforms out there are MetaTrader and TradingView, and for this post, I’ll take you through using those two.
What kind of chart do you use for drawing support and resistance levels?
The best chart to use drawing support and resistance zones is a candlestick chart. Some people like to use a line chart, but candlestick charts is able to fit in a lot more data and they make it much easier to see price levels and the way price moves.
Support and resistance zones are already quite subjective, so you want as much accuracy as possible. A line chart will just not be able to show you that degree of accuracy.
Using MetaTrader 4
In MetaTrader 4, you can go to Toolbars => Line Studies and select from a number of drawing tools like horizontal lines, trendlines, and shapes.
If you don’t see shapes, you can right-click the line studies toolbar, select Customize, and enable the shapes you need.
Using TradingView
Head over to TradingView and pull up a price chart.
In the toolbar on the left, you’ll see a few drawing tools you can use.
The second icon is for line studies. If you press and hold the button, you’ll get a long list of lines you can draw.
The ones that you’ll likely use most are the Trend Line and Horizontal line.
To draw a trend line, select it from the toolbar and click anywhere on the chart to start drawing.
Then drag the mouse to drag the trendline, and click again to fix it in place.
To draw a horizontal line, select it from the toolbar and go to any price level, then click to place the line.
To adjust the line, you can click on it to select it and then click and drag it up and down.
To draw zones, click and hold the fourth icon and select the rectangle. Then click and drag the rectangle.
Horizontal support and resistance levels vs trend lines
Support and resistance lines can be both horizontal or angled(trend lines).
Trend lines work very similarly to horizontal zones, except instead of price respecting the same price every time, the area where selling interest or buying interest comes back in slopes up or down.
I am part of the pure price action traders group, and I generally don’t use a trend line, as horizontal levels tend to work better for me.
To draw a trendline, you’ll need to look for swing lows or swing highs.
Find two swing lows or swing highs and join them with a line, then extend the line further.
Trendlines are even more subjective than support or resistance lines, so it’s possible you can visualize a trend line in one way and someone else would see something else entirely.
Sometimes, you’ll be able to spot a trendline and then draw a parallel trendline right above or below it.
This is called a channel, and when used correctly, channels can be a very powerful trading strategy.
Should you draw trendlines from wicks or candle closes?
Trendlines can be drawn on price charts using both candle closes and candle wicks.
In some cases, you’ll see that price wicked up or down to respect the level before reversing and continuing on its merry way.
In other cases, you’ll see that a candle wicked through the trendline only to close above or below it. This indicates that price tried to break through but was not able to maintain the break.
Round number support and resistance levels
Another form of support and resistance zones are round number areas.
Forex trading is trading real currency pairs after all, and the actual value of the currency has a real-world impact.
That’s why round number or psychological support and resistance zones can be very powerful.
Round number figures can be areas like 1.1000, 1.2100, 1.1100, 123.00, 144.50, and so on.
Price will not always respect these levels, but in some cases, when price is falling or rising rapidly, it will encounter support or resistance at these levels.
If these zones coincide with a technical area of support or resistance, then it’s an even stronger indicator that price may respect this level.
Fibonacci support and resistance levels
A fascinating aspect of technical analysis is the Fibonacci retracement.
Fibonacci retracements use Fibonacci ratios of 1.382, 1.5, and 1.618 to map out potential areas that price may pull back to after a move in one direction.
Fibonacci levels don’t always work, but when they coincide with a previous support level or resistance level, they can be a strong added confirmation.
To draw a Fibonacci retracement, find a swing high and a swing low. If the move was downwards, draw a fib from the high to the low, and if the move was upwards, draw a fib from the low to the high.
Your charting software will automatically generate the 1.382, 1.5, and 1.618 levels as you draw the fib line.
Dynamic support and resistance levels
The last type of support and resistance levels that are used in technical analysis are dynamic support and resistance levels.
Dynamic support and resistance zones are usually moving averages or other on-chart indicators like Bollinger bands.
Moving averages
Moving averages can be very powerful tools, but they’re incredibly subjective.
There’s no consensus on which moving average you should use!
A lot of traders use the 200, 100, 50, and 20 period moving averages in some combination for their trading.
When you load up the moving average on your chart, you’ll be able to see that price repeatedly respects the moving average as price moves.
Here’s the catch with moving averages, though:
You can load up pretty much any period moving average and you’ll see that price will respect it at some point or the other. That’s just due to the slightly random nature of price!
Some moving averages like the 200, 100, and 50 period moving averages seem to work better because a lot more traders use them.
Don’t depend solely on moving averages for support and resistance levels, but use them as forms of added confirmation. When a moving average lines up with a trendline, a horizontal support or resistance level, or a Fibonacci level, there’s a much higher likelihood it will be respected.
More: Learn about break of market structure
Using support and resistance levels in your trading strategy
Support and resistance levels should be the backbone of your trading plan. Trading success depends a lot on your ability of identifying support and resistance levels, and major market moves are usually from one level of support to another.
You’ll use support and resistance zones as the basis for your technical analysis.
Support and resistance lines are good areas to look for trade entries, and also good areas to look for exit points.
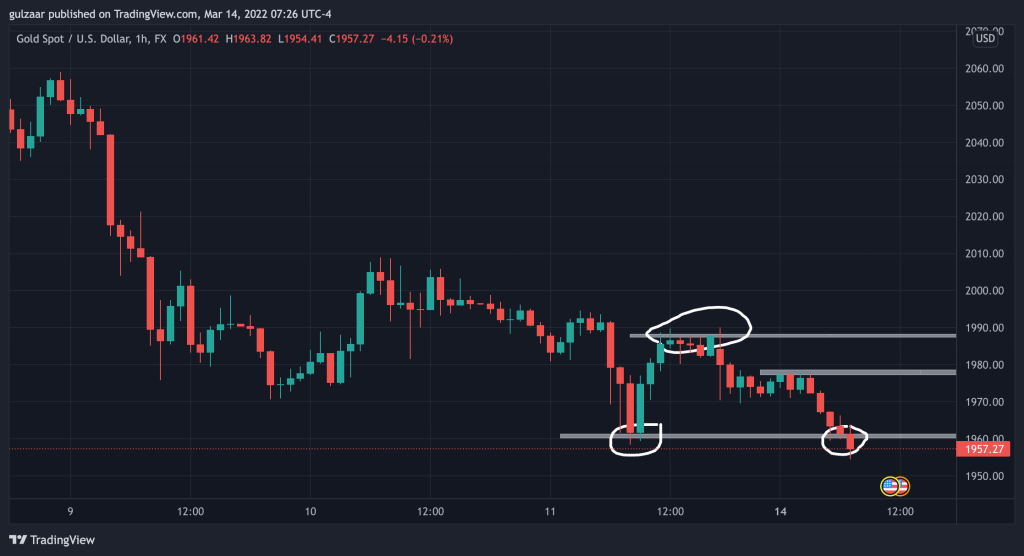
The safest entries are when price breaks a support or resistance and retests it before continuing. Some pairs like GBP/JPY and Gold are very volatile and you may not see a whole candle retest support or resistance: instead, you may just see a wick to retest the level before price continues.
Remember, the markets are very dynamic, so it’s not necessary that price will reach the support level or resistance areas that you’ve drawn. Price can and will stop before or push through!
Many traders fall into the trap of setting profit targets right at the zones. Instead, it’s better to secure some profits a few pips before the zone you have marked, then let the trade run with zero risk.
Conclusion
Support and resistance lines are price points that the market moves to and from. It will take a lot of practice to identify support and resistance levels properly, but once you get the hang of it, you’ll be able to easily visualize the zones when you pull up the chart!