As an experienced trader, I’ve used various techniques to navigate the financial markets. Among the many methods I’ve employed, one stands out: the Bollinger Bands Trading Strategy. Today, I want to share my insights and knowledge to help you understand and master this powerful trading tool.
What are Bollinger Bands?
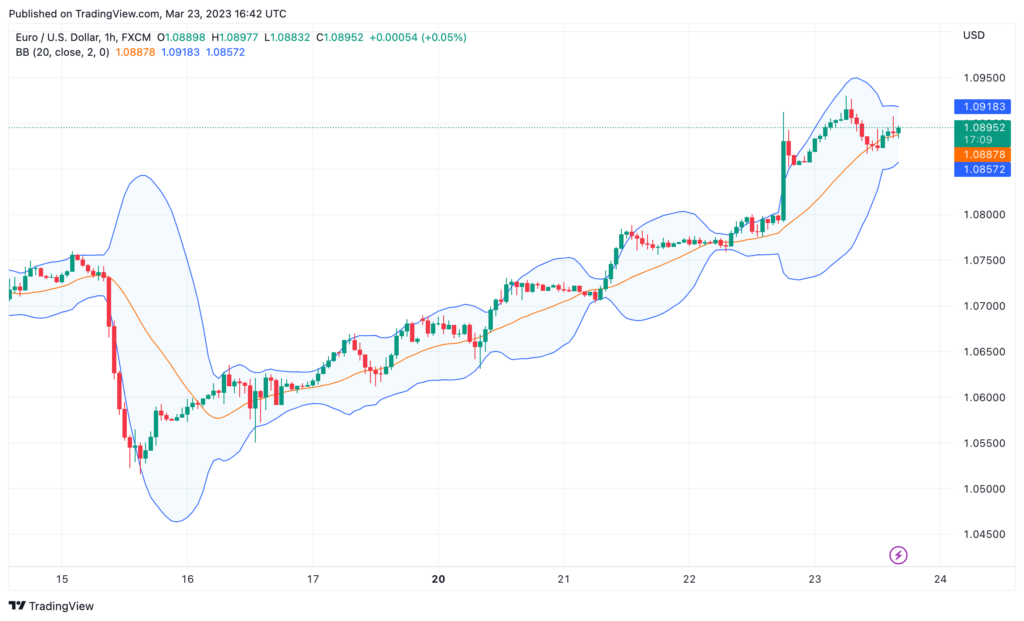
Bollinger Bands are a technical analysis tool created by John Bollinger in the 1980s. They’re designed to help traders identify potential price movements and gauge market volatility. Bollinger Bands consist of three lines: a simple moving average (SMA) and two bands – one above and one below the SMA – that are standard deviations away from the average.
Why Use Bollinger Bands?
The primary reason traders use Bollinger Bands is that they provide a unique perspective on price movements. By capturing the inherent volatility of financial instruments, Bollinger Bands allow you to make more informed decisions based on market conditions.
They’re versatile, which means they can be applied to various timeframes and markets, making them a valuable addition to any trading strategy.
Bollinger Bands Measure Volatility
Volatility is a crucial factor in trading as it impacts the potential for profit and loss. Bollinger Bands measure this volatility by widening or contracting based on the degree of price fluctuations.
When the bands widen, it signals increased volatility, while contracting bands tend to indicate reduced volatility. This information can help you determine when to enter or exit a trade, as well as how to manage your risk.
Using Bollinger Bands to Identify Breakouts
Breakouts are significant price movements that occur when a financial instrument breaks through an established trading range or pattern. Bollinger Bands can help you spot potential breakouts by highlighting when prices are likely to move beyond the bands.
Bollinger Band Squeeze
A Bollinger Band squeeze occurs when the bands contract, indicating a period of low volatility. This is typically followed by a sudden and sharp price movement, known as a breakout. Traders can capitalize on the next bollinger bands squeeze by preparing for the breakout and entering trades as the bands begin to widen.
Using Bollinger Bands to Ride Trends
Bollinger Bands are also useful for identifying and riding trends. When the price consistently moves and stays above or below the middle band (SMA), it may indicate the presence of a strong trend. By observing this price action, you can participate in the trend and potentially profit from it.
Common Bollinger Bands Mistakes
Like any trading tool, Bollinger Bands aren’t foolproof. Some common mistakes traders make when using them include relying solely on the bands for decision-making, disregarding the overall market context, and overreacting to short-term price movements.
Best Bollinger Bands Settings
The default settings for Bollinger Bands are a 20-day SMA and two standard deviations. However, depending on your trading style and the market you’re trading in, you may need to adjust these settings. Experiment with different settings to find the ones that work best for your specific situation.
Support and Resistance Levels with Bollinger Bands
Bollinger Bands can also help you identify support and resistance levels. The upper and lower bands can act as dynamic support and resistance, where prices often bounce off these levels. By paying attention to these interactions, you can gain valuable insights into potential price reversals and entry or exit points.
Bollinger Bands vs Straight Trend Lines
While Bollinger Bands can help you identify trends, they differ from straight trend lines in that they adapt to changing market conditions. Trend lines are static and rely on the trader to draw and update them manually. Bollinger Bands, on the other hand, automatically adjust to market volatility, providing dynamic support and resistance levels that can be more informative than straight trend lines.
Indicators to Combine with Bollinger Bands
To enhance your trading strategy, you can combine Bollinger Bands with other technical indicators. Some popular choices include:
Relative Strength Index (RSI): This momentum oscillator can help you identify overbought or oversold conditions when used alongside Bollinger Bands.
Moving Average Convergence Divergence (MACD): Combining Bollinger Bands with the MACD can provide additional confirmation of trend changes and potential trade entry points.
Stochastic Oscillator: This indicator can help you identify potential trend reversals when used in conjunction with Bollinger Bands.
Bollinger Bands vs Keltner Channel
The Keltner Channel is another technical indicator similar to Bollinger Bands, but it uses average true range (ATR) instead of standard deviation to determine the channel’s width. While Bollinger Bands focus on price volatility, the Keltner Channel considers both price and volatility. Depending on your trading style, you may prefer one over the other or even use both in tandem to enhance your analysis.
Bollinger Bands vs VWAP
Volume Weighted Average Price (VWAP) is a trading benchmark that calculates the average price of an asset, weighted by volume. While Bollinger Bands help gauge volatility and identify potential price movements, VWAP focuses on the relationship between price and volume. Some traders use both Bollinger Bands and VWAP to complement their analysis and make more informed decisions.
Bollinger Bands vs Moving Average
A moving average is a simple calculation that smooths out price data to help identify trends. Bollinger Bands include a moving average as their middle band (SMA), but also provide additional context by incorporating the upper and lower bands to measure volatility. In this sense, Bollinger Bands offer more comprehensive information than a standalone moving average.
A Detailed Bollinger Bands Strategy
1. Set Up Bollinger Bands with Your Preferred Settings
The default Bollinger Bands settings are a 20-day simple moving average (SMA) for the middle band and two standard deviations for the upper and lower bands. Depending on your trading style and the market you’re trading, you may want to adjust these settings. For instance, you can experiment trading bollinger bands with a 50-day SMA or modify the standard deviations to better fit the asset’s volatility.
2. Identify the Bollinger Band Squeeze
Monitor the Bollinger Bands for a squeeze, which occurs when the bands contract and come close together. This indicates a period of low volatility, often followed by a sharp price movement or breakout. To increase the likelihood of a successful trade, look for squeezes that happen after a prolonged trend or when other technical indicators suggest a reversal.
3. Confirm the Breakout
Once you’ve identified a squeeze, wait for a breakout confirmation before entering a trade. A confirmation occurs when the price closes above the upper band or below the lower band. This signals that the price has broken out of the trading range, and a strong price movement is likely to follow.
4. Use Additional Technical Indicators
To increase the probability of a successful trade, use other technical indicators alongside Bollinger Bands. For instance, you can use the Relative Strength Index (RSI) to determine whether an asset is overbought or oversold during a breakout. Similarly, the Moving Average Convergence Divergence (MACD) can help confirm trend changes and potential entry points. Combining multiple indicators can provide a more comprehensive analysis of the market and increase your chances of success.
5. Set Your Stop-Loss and Take-Profit Levels
Before entering a trade, it’s crucial to define your risk management strategy. Set a stop-loss level to protect your capital in case the trade goes against you. You can place the stop-loss slightly above the upper band (for a short trade) or below the lower band (for a long trade). Take-profit levels should be set based on your risk-to-reward ratio or at significant support and resistance levels.
6. Practice and Refine Your Skills
As with any trading strategy, practice is essential for success. Before applying it to live markets, use a demo account or historical data to test and refine the Bollinger Bands strategy. Analyze your trades and learn from both successes and failures to continually improve your skills and understanding of the markets.
By following these steps and incorporating other technical indicators into your analysis, you can develop a more robust Bollinger Bands strategy to help you navigate the financial markets more confidently.
Conclusion
Bollinger Bands are a versatile and powerful tool for traders seeking to navigate the complex world of financial markets.
By understanding their underlying principles and learning how to effectively use them in conjunction with other indicators, you can develop a more robust trading strategy.
As with any trading tool, practice and patience are key to mastering the Bollinger Bands Trading Strategy. So go ahead, give it a try, and see how it can enhance your trading journey.