Learning to identify break of structure is a key part of Forex trading. It’s the foundation of technical analysis, as it shows you how price reacts to key levels in the market.
What is market structure?
Market structure is the levels that are created by the price action of any currency in the FX market as it moves up and down.
Price never moves in a single direction for too long. It always takes a few steps in one direction, then moves a few steps back, then a few more steps, then a few steps back.
Over time, these steps form distinct structures in the market: zones of consolidation, zones of support, zones of resistance, and zones where price impulses up and down.
Market structures that form in the past are often respected in the future, and analyzing previous market structure can form a basis for a trading plan.
How is market structure broken?
When a break of market structure occurs, it signifies that the price has penetrated a level it previously adhered to. This phenomenon becomes most apparent when the market forcefully moves beyond areas of consolidation, highlighting the significant impact of a break of market structure.
Other times, break of structure can happen when price breaks through an area of strong support or resistance that it had previously respected for a very long time.
The market can also break structure when it breaks through a retracement level instead of respecting it. For example, if the price of a currency pair is in an uptrend and the market is retracing, you would expect it to create a support and continue pushing up.
However, this does not always happen and price can fall through the support area to reverse downwards.
The opposite works for when price is in a downtrend.
These three are the most common types of market structure breaks, though there are many variations.
How to trade breaks of market structure
Now that you know how market structure breaks, how do you actually trade breaks of market structure?
How to trade breakouts
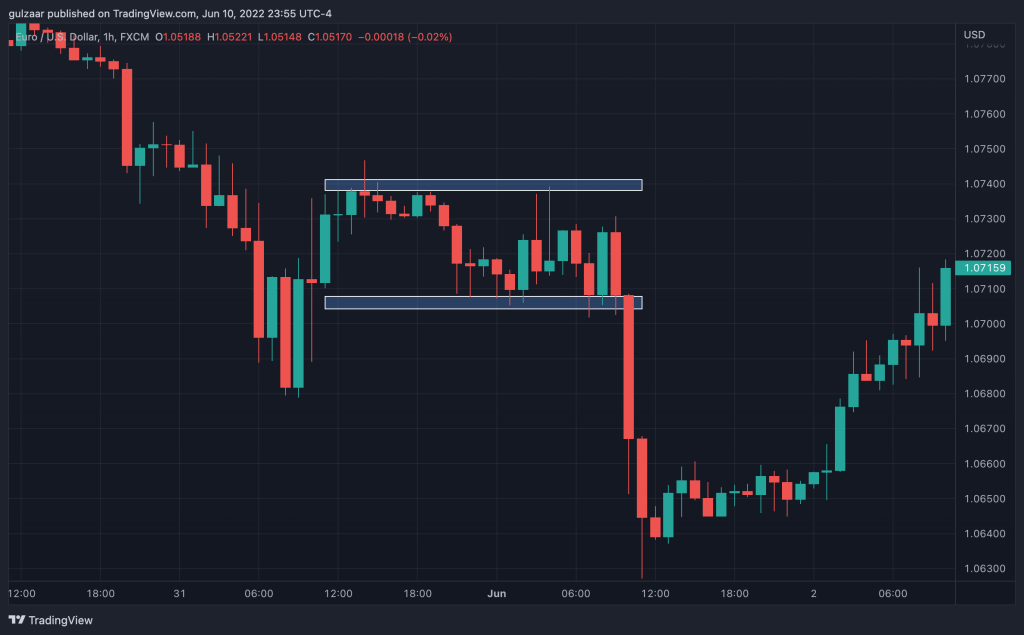
The first kind of market structure break is a classic consolidation and breakout.
Trading breakouts is fairly easy.
The secret sauce to successfully trading a breakout is the time of day which you trade. Breakouts will usually happen when there is a lot of trading activity in the market, such as the Asian open, the London open, or the New York open.
If you identify a consolidation area in the price of a currency pair shortly before these high-volume times, chances are the volume coming in at the start of the trading day will be able to push the price out of consolidation.
Trading these can be as simple as placing a buy stop order a few pips above the consolidation area and a sell stop order a few pips below the consolidation area.
Your stop loss can be halfway inside the consolidation area, or above/below the high/low of the last one hour candle.
How to trade breaks of strong levels of support and resistance
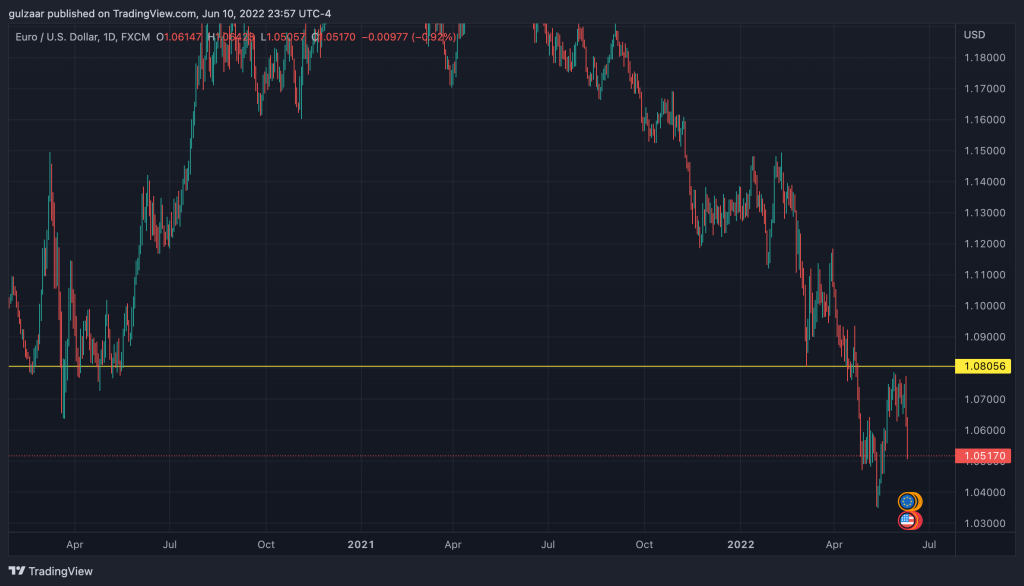
The next type of market structure that we identified was a break of a strong level of support and resistance.
You actually have two ways of trading this: in the breakout itself, or after a pullback.
If you wish to trade the breakout itself, it must be during a high volume time when you expect price to move a good number of pips so you can quickly get in and out of the trade.
You can wait for price to close above or below the zone to make sure it’s not a fakeout, and place a trade at the start of the next candle. Your stop loss can be a few pips above or below the zone(aggressive), or above/below the low/high of the previous candle(conservative).
The nature of the currency pair you trade will also make a difference.
For example, pairs like GBP/JPY and Gold tend to move very quickly and it’s easy to catch 20-30 pips on a single 30 minute or one hour candle.
Pairs like the EUR/USD move slower.
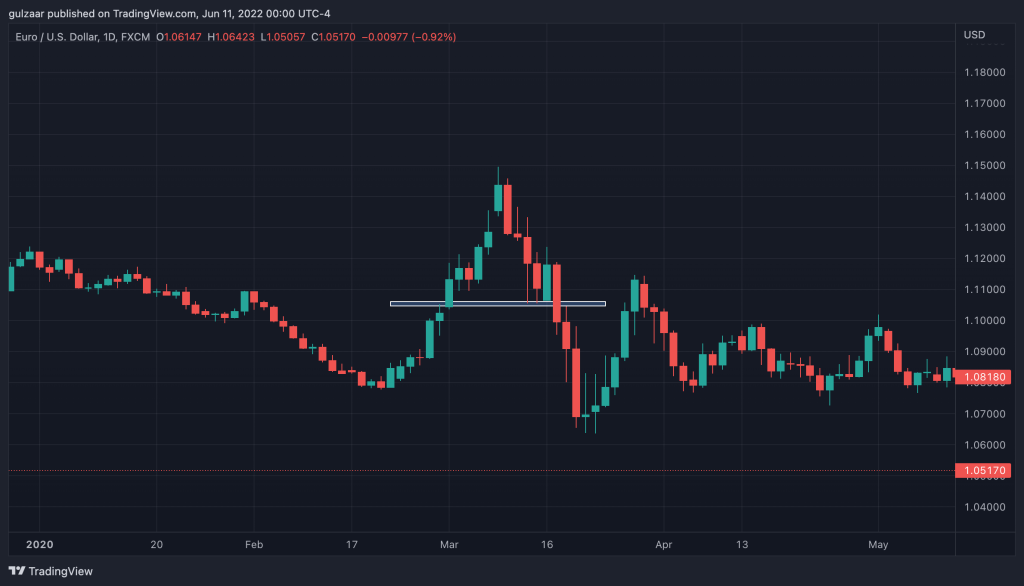
A more conservative trade would be to wait for price to do a proper pullback to somewhere near the zone and then place a trade to retest the new high or low created.
This closely ties in to understanding when the market is gaining momentum and when it’s losing it.
How to trade breaks of structure in a trending market
When the market is trending, it either makes successive higher lows and higher highs or lower lows and lower highs.
A currency pair is in an uptrend as long as the higher lows are respected. Once a lower low is formed, it suggests a possible trend change due to price breaking structure, especially if it fails to make a higher high again.
The reverse is true for downward movement, where the market structure dictates that price should form lower highs and lower lows. Once a higher high is formed, the structure has broken and a trend reversal is possible.
Timeframes and market structure
One very unique aspect of the Forex market is that it is fractal, meaning all timeframes behave in more or less the same manner.
If I were to show you a chart without any indications of time, you would not be able to tell if it’s a daily, hourly, or even one minute chart.
However, one key factor to keep in mind is that levels created on higher timeframes are stronger than levels created on lower timeframes.
So if you see price approaching a level that was previously created on a daily chart, there’s a much stronger chance that it will be respected compared to a level created on a 1 hour or 30 minute chart.
Similarly, levels created on 1 hour and 30 minute charts are more likely to be respected compared to levels created on 5 minute and 1 minute charts.
So whenever you observe market structure, ask yourself what timeframe this structure is playing out on and base your trading decisions off of that.
Break of Structure Forex Indicators
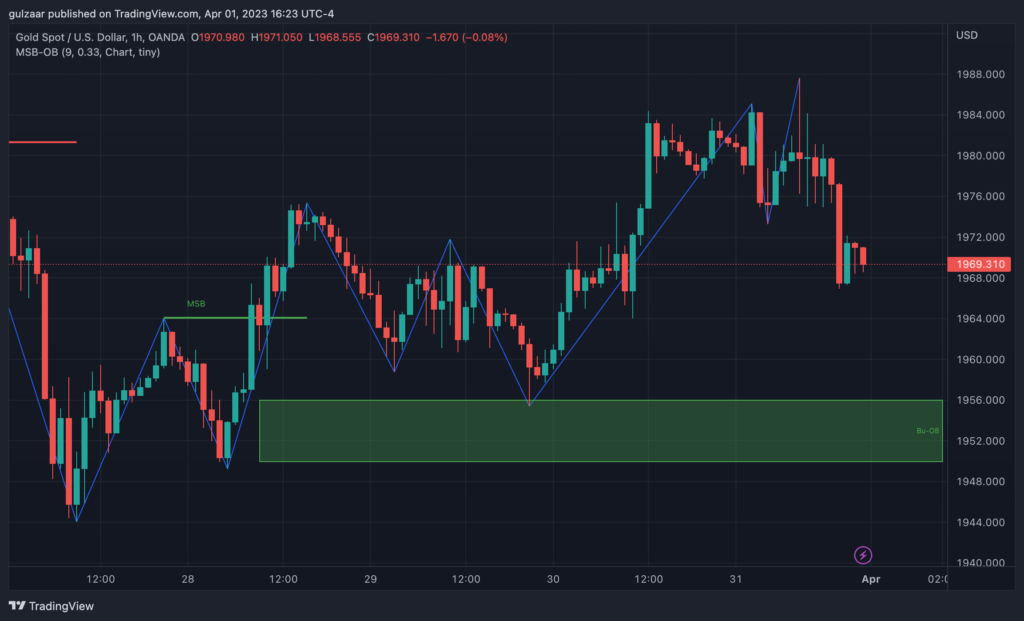
TradingView has many great community indicators, and of all the break of structure indicators I found, this one developed by EmreKb is the best.
It draws a zigzag, breaks of market structure, as well as order blocks.
To really capitalize on this indicator, look for when market structure breaks into order blocks, and then look for entries from those order blocks.
For shorter term entries, you can jump in once the market structure is broken and ride the momentum for as long as possible.
Conclusion
Understanding break of market structure and knowing how to trade it can make a huge difference in your trading.
Remember to be patient, wait for the market to come to you, and execute your trades with confidence.