As someone who has been personally involved in forex trading for years, I can attest to the importance of indicators in making informed trading decisions. In this article, I’ll share my knowledge and experience to help you understand what forex trading indicators are, which ones to use, and how to employ them in your trading strategy.
What are Forex Trading Indicators
Forex trading indicators are tools used by traders to analyze the market and make better-informed decisions. These indicators are based on mathematical algorithms that process historical and current market data, providing valuable insights into trends, volatility, and momentum.
Indicators can be categorized into different types, such as trend indicators, oscillators, and volatility indicators.
What Indicators to Use in Forex Trading
To make the most of forex trading, it’s crucial to familiarize yourself with the variety of indicators available. Let’s delve into some of the most popular and widely-used indicators:
Trend Indicators
Trend indicators help traders identify the direction of the market and potential entry and exit points. Some popular trend indicators include:
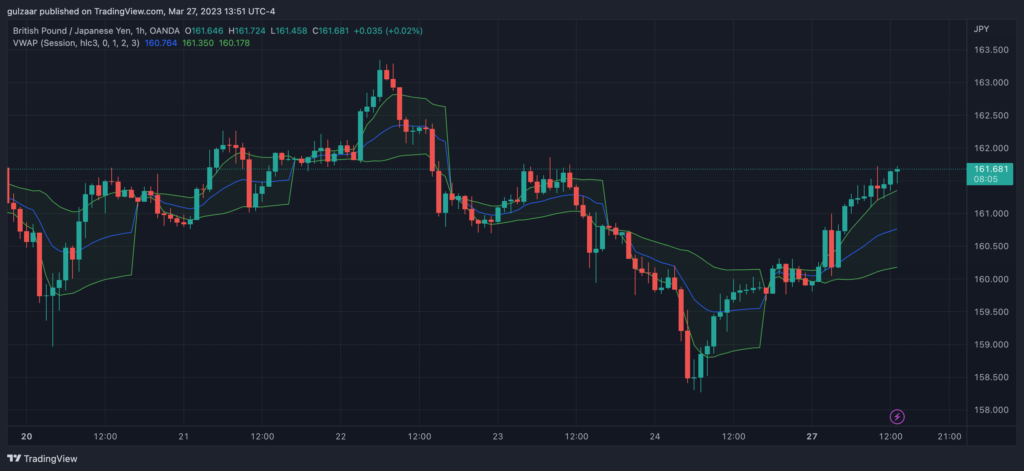
Volume Weighted Average Price (VWAP)
VWAP is an indicator that calculates the average price of a currency pair, weighted by the volume of each trade. It helps traders determine the fair value of a currency pair, identify potential support and resistance levels, and assess the market’s liquidity.
Average True Range Indicator
The Average True Range (ATR) indicator measures the volatility of a currency pair by calculating the average range between its high and low prices over a specific period. This can help traders gauge the market’s potential for large price movements and set appropriate stop-loss and take-profit levels.
Average Directional Movement Index Indicator
The Average Directional Movement Index (ADX) measures the strength of a trend without considering its direction. A high ADX value indicates a strong trend, while a low value suggests a weak or non-trending market.
Moving Averages
Moving Averages smooth out price data, making it easier to spot trends and reversals. There are different types of moving averages, such as simple, exponential, and weighted moving averages. They can be used as dynamic support and resistance levels or as crossovers to generate trading signals.
Bollinger Bands
Bollinger Bands consist of a moving average and two standard deviation bands above and below it. They help traders identify periods of high and low volatility, potential breakouts, and overbought or oversold conditions.
Oscillators
Oscillators are indicators that measure the momentum of price movements. They can help traders identify potential reversals and overbought or oversold conditions. Some widely used oscillators include:
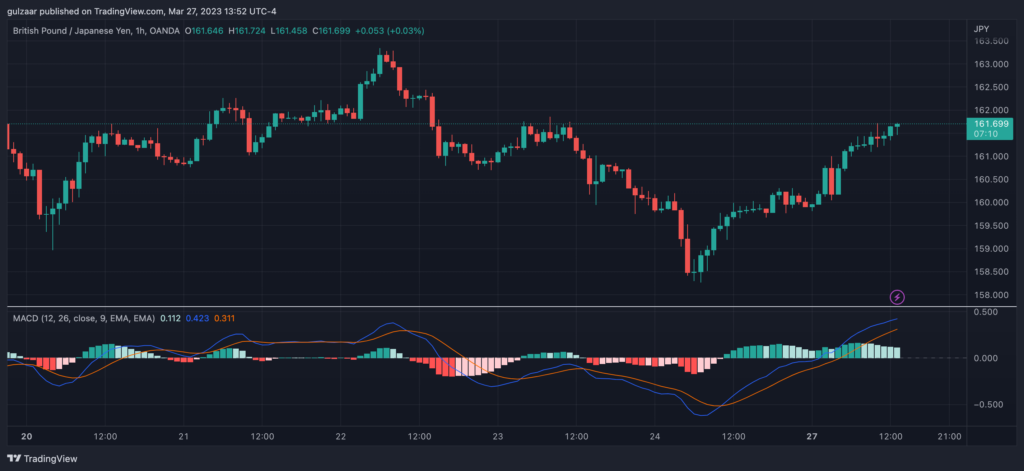
MACD
The Moving Average Convergence Divergence (MACD) is a popular momentum indicator that shows the relationship between two moving averages. It can help traders identify potential trend reversals and confirm existing trends.
RSI
The Relative Strength Index (RSI) measures the speed and change of price movements. It can help traders identify overbought or oversold conditions and potential reversals.
Stochastic Indicator
The Stochastic Indicator compares a currency pair’s closing price to its price range over a specific period. It helps traders identify overbought or oversold conditions and potential trend reversals.
Volatility Indicators
Volatility indicators measure the degree of price fluctuations in the market. They help traders assess market conditions and adjust their strategies accordingly. Some common volatility indicators include:
Average True Range Indicator
As mentioned earlier, the Average True Range (ATR) is a volatility indicator that measures the average range between the high and low prices of a currency pair over a specific period.
Bollinger Bands
Bollinger Bands, which we’ve also discussed earlier, help traders identify periods of high and low volatility in addition to potential breakouts and overbought or oversold conditions.
How to Use Indicators
Indicators can be used in various ways to improve your forex trading strategy. Here are some ways you can employ them:
To Confirm Entry and Exit Points
Indicators can help you identify potential entry and exit points in the market. For instance, moving average crossovers, MACD crossovers, or breakouts from Bollinger Bands can signal potential trading opportunities.
To Determine Whether to Stay in a Trade
Indicators can provide valuable information about the current market conditions, helping you decide whether to hold onto a position or close it. For example, if the RSI indicates overbought conditions, you might consider closing a long position to lock in profits.
As Added Confirmation Before Entering a Trade
Using multiple indicators can provide additional confirmation before entering a trade. For example, you might look for a moving average crossover combined with an overbought or oversold signal from the RSI to increase the probability of a successful trade.
As a Part of an Algorithmic Trading Strategy
Indicators can be incorporated into algorithmic trading strategies to automate trading decisions based on predefined conditions. This can help minimize emotional bias and improve the consistency of your trading.
Conclusion
Forex trading indicators are essential tools that can help you make better-informed decisions in the market. By understanding the different types of indicators and how to use them, you can develop a more effective trading strategy.
Remember to combine various indicators and use them in conjunction with other aspects of technical and fundamental analysis to maximize your chances of success in the forex market.