Forex trading is an exciting field for traders looking to make significant returns on their investments. However, like all other financial investments, it comes with its challenges, and traders must be equipped with the right tools to navigate the market successfully.
One essential tool that every trader should have in their arsenal is the Forex chart.
A Forex chart is a graphical representation of the price movement of a currency pair over a specific period.
With the right Forex charts and tools, traders can analyze the market and make informed trading decisions.
Types of Price charts that all serious traders should know
There are different types of price charts in Forex trading, each with its pros and cons. Understanding the various types of charts is essential to know which one works best for your trading strategy.
Line Chart
The line chart is a basic chart that plots the closing prices of a currency pair over time. It is the most common chart used in Forex trading, and it is a simple chart that is easy to read. The line chart is ideal for traders who are new to Forex trading, and it is an excellent tool for identifying trends.
Line chart pros
One of the significant advantages of the line chart is its simplicity. It is easy to read and understand, making it an excellent tool for beginners. The line chart provides a clear picture of the currency pair’s trend, and traders can quickly determine whether the price is rising or falling. This chart also allows traders to spot support and resistance levels with ease.
Line chart cons
One of the disadvantages of the line chart is that it only plots the closing price of the currency pair. This means that it does not provide information on the high, low, or opening prices, making it less detailed than other charts. The line chart also does not provide information on the market’s volatility, making it less useful for short-term traders.
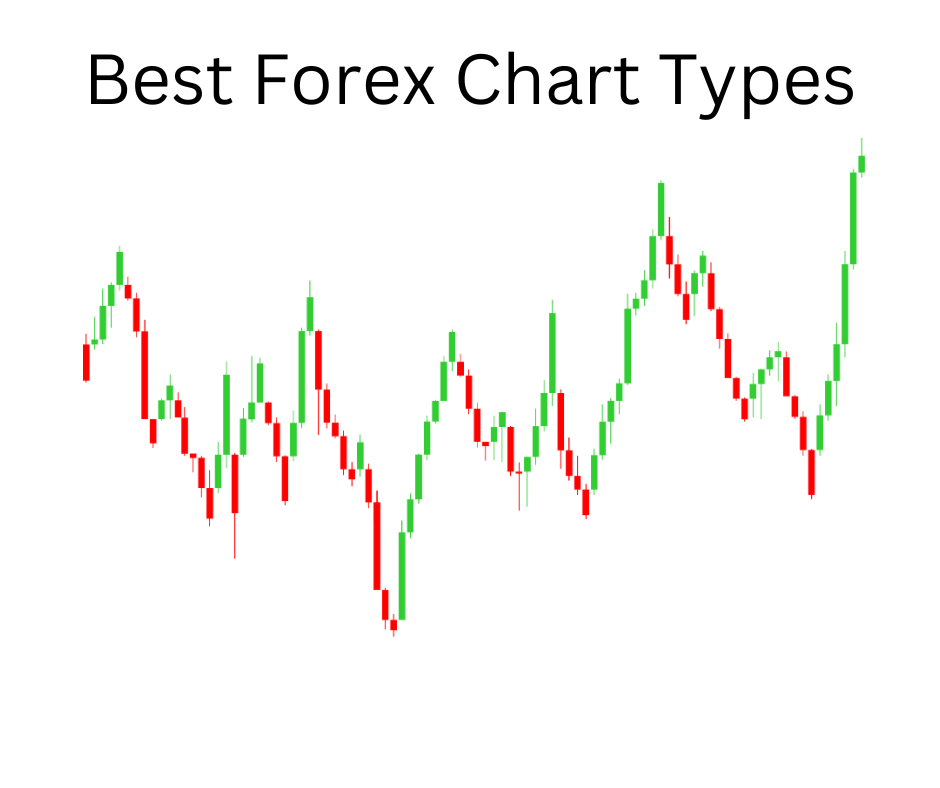
Candlestick Charts
The candlestick chart is another popular chart used in Forex trading. This chart is similar to the line chart, but it provides more information on the currency pair’s price movement. A more detailed chart provides forex traders with a better understanding of the market.
Candlestick chart pros
One of the advantages of the candlestick chart is that it provides more information than the line chart. It shows the opening, closing, high, and low prices of the currency pair, making it easier for traders to identify patterns in the market.
The candlestick chart also provides information on the market’s volatility, making it an excellent tool for short-term traders.
Candlestick chart cons
One of the disadvantages of the candlestick chart is that it is more complex compared to the line chart. It may take some time for beginners to understand the various patterns and formations of the candlesticks.
The candlestick chart may also provide conflicting signals, and traders must be careful when interpreting the various chart patterns.
Bar Chart
The bar chart is another type of chart used in Forex trading. It provides more information than the line chart, but less detailed compared to the candlestick chart. The bar chart is similar to the candlestick price chart, but it uses bars instead of candlesticks to represent the currency pair’s price movement.
Bar chart pros
One of the advantages of the bar chart is that it provides more information compared to the line chart. It shows the opening price, closing, high, and low prices of the currency pair, making it easier for traders to identify patterns in the market. The bar chart is also easy to read, making it an excellent tool for beginners.
Bar chart cons
The bar chart may be difficult for beginners to understand. The chart uses bars to represent the price movement of the currency pair, and it may take some time for beginners to understand how to interpret the chart properly.
This may lead to incorrect interpretations and trading decisions, which can result in losses.
Heiken Ashi Chart
The Heiken Ashi chart is a unique type of chart used in Forex trading. Unlike other types of charts, the Heiken Ashi chart filters out the noise in the market, making it easier for traders to identify trends. This chart is excellent for traders who are looking to identify trends in the market.
Heiken Ashi chart pros
One of the significant advantages of the Heiken Ashi chart is that it filters out the noise in the market. This makes it easier for traders to identify trends.
The Heiken Ashi chart also provides clearer signals, making making informed trading decisions easier.
Heiken Ashi chart cons
One of the disadvantages of the Heiken Ashi chart is that it may not provide enough information for short-term traders.
The chart filters out the noise in the market, which means that it may not show the same level of volatility as other charts.
Traders who are looking to make short-term trades may need to use other types of charts in conjunction with the Heiken Ashi chart.
Point and Figure Charts
The Point and Figure chart is a unique type of chart used in Forex trading. This chart differs from other charts as it does not plot the price against time. Instead, it plots the price against changes in the direction of the trend.
This chart is an excellent tool for traders who are looking to identify long-term trends in the market.
Point and Figure chart pros
One of the advantages of the Point and Figure chart is that it is an excellent tool for identifying long-term trends. The chart does not plot the price against time, which means that short-term fluctuations in the market do not affect it.
The Point and Figure chart also provides clear signals, making making informed trading decisions easier.
Point and Figure chart cons
One of the disadvantages of the Point and Figure chart is that it may not provide enough information for short-term traders. Because the chart does not plot the price against time, meaning it may not show the same level of volatility as other charts.
Traders who are looking to make short-term trades may need to use other types of charts in conjunction with the Point and Figure chart.
Which chart is the best?
The best chart for Forex trading depends on the trader’s trading strategy. Each chart type has pros and cons, and traders must choose the forex chart types that works best for their trading strategy.
For traders who are new to Forex trading, the line chart is an excellent tool to start with. It is simple and easy to read and provides a clear picture of the currency pair’s trend.
For traders who are looking to make short-term trades, the candlestick chart is an excellent tool. It provides more information compared to bar charts and to the line chart, and it is an excellent tool for identifying patterns in the market.
For traders who are looking to identify long-term trends, the Heiken Ashi chart and Point and Figure chart are excellent tools. These charts filter out the noise in the market, making it easier for traders to identify trends.
Timeframes in Forex Trading
Another critical factor to consider when using Forex charts is the timeframe. The timeframe refers to the duration of the chart, and it plays a significant role in the technical analysis of the market. Traders can use different timeframes to identify trends and make informed trading decisions.
Short-Term Timeframes
Short-term timeframes are those that cover a period of a few minutes to a few hours. Traders who use short-term timeframes are referred to as day traders or scalpers. These traders aim to profit from small price movements in the market, and they usually hold their positions for a few minutes to a few hours.
Short-term timeframes are ideal for traders who are looking to make quick profits. However, they require a lot of focus and attention, as traders need to monitor the market constantly.
Medium-Term Timeframes
Medium-term timeframes are those that cover a period of a few hours to a few days. Traders who use medium-term timeframes are referred to as swing traders. These traders aim to profit from medium-term trends in the market, and they usually hold their positions for a few days.
Medium-term timeframes are ideal for traders who are looking to profit from medium-term trends in the market. They require less attention compared to short-term timeframes, but they still require a significant amount of focus and attention.
Long-Term Timeframes
Long-term timeframes are those that cover a period of a few days to a few months. Traders who use long-term timeframes are referred to as position traders. These traders aim to profit from long-term trends in the market, and they usually hold their positions for a few weeks to a few months.
Long-term timeframes are ideal for traders who are looking to profit from long-term trends in the market. They require less attention than short-term and medium-term timeframes but still require traders to understand the market well.
More:
Best websites for Forex charts
Conclusion
Forex trading is an exciting field, and traders must have the best tools to navigate the market successfully. Forex charts are an essential tool for traders, and traders can use different types of charts. Each chart type has pros and cons, and traders must choose the chart that works best for their trading strategy.
Using the best Forex charts and tools, traders can analyze the market and make informed trading decisions.