If you’re new to trading, you’ve probably come across the terms “support and resistance” and “pivot points.” These are two popular technical analysis tools used by traders to predict price movements in the financial markets.
In this article, we’ll explore the differences between support and resistance levels and pivot points and how to calculate them and use them in your trading strategies.
What are support and resistance levels?
Support and resistance levels are price levels where the market has previously shown a tendency to either “support” the price from falling further, or “resist” the price from rising higher. Traders use these levels to predict where the price is likely to reverse direction or continue its trend.
Support levels are price levels where buying pressure is strong enough to overcome selling pressure, causing the price to bounce back up. Resistance levels are price levels where selling pressure is strong enough to overcome buying pressure, causing the price to bounce back down.
Support and resistance levels can be identified by looking at historical price charts and identifying where the price has previously bounced off of a particular level. Traders can also use technical indicators like moving averages, Bollinger Bands, and Fibonacci retracements to help identify support and resistance levels.
What are pivot points?
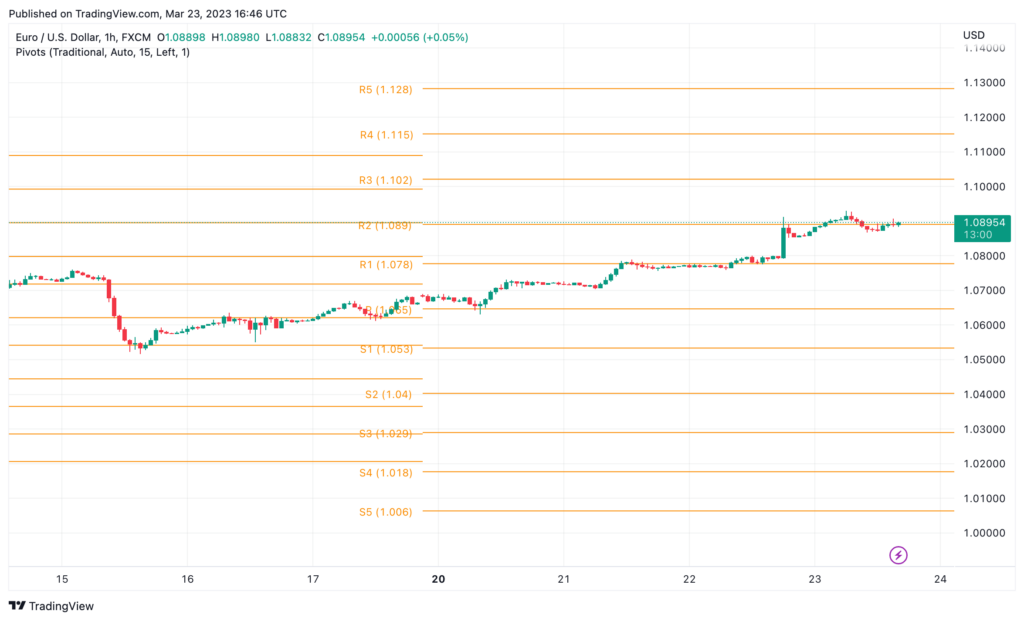
Pivot points are another popular technical analysis tool used by traders to predict price movements. Pivot points are calculated based on the previous day’s price action and are used to identify potential support and resistance levels for the current trading day.
There are several different ways to calculate pivot points, but the most common method is to use the previous day’s high, low, and closing prices. The formula for calculating pivot points is as follows:
Pivot Point = (Previous Day’s High + Previous Day’s Low + Previous Day’s Close) / 3
Traders can also calculate additional support and resistance levels by using the following formulas:
First Support (S1) = (Pivot Point x 2) – Previous Day’s High Second Support (S2) = Pivot Point – (Previous Day’s High – Previous Day’s Low) Third Support (S3) = Previous Day’s Low – 2(Previous Day’s High – Pivot Point)
First Resistance (R1) = (Pivot Point x 2) – Previous Day’s Low Second Resistance (R2) = Pivot Point + (Previous Day’s High – Previous Day’s Low) Third Resistance (R3) = Previous Day’s High + 2(Pivot Point – Previous Day’s Low)
How to calculate pivot point levels
To calculate pivot points, you’ll need access to a charting platform allowing you to input the previous day’s high, low, and closing prices. Once you have these values, you can use the above formulas to calculate the pivot point and the first, second, and third support and resistance levels.
If you’re using a charting platform like MetaTrader or TradingView, the platform will automatically do the calculations for you. All you need to do is select the “Pivot Points” indicator and input the previous day’s high, low, and closing prices.
Should you rely on pivot points or support and resistance levels alone?
Both pivot points and support and resistance levels can be useful tools for predicting price movements in the financial markets. However, it’s important to note that neither tool is foolproof and should not be relied on exclusively.
Support and resistance levels are based on historical price data and are more reliable when a strong trend is in place. Pivot points, on the other hand, are calculated based on the previous day’s price action and are more useful when the market is range-bound or choppy.
Traders should also consider other technical indicators and fundamental analysis when determining their trading strategies. It’s important to have a well-rounded approach and not rely on any single indicator or tool.
How to combine pivot points and support and resistance levels
One way to use pivot points and support and resistance levels together is to look for confluence between the two. Confluence occurs when multiple technical indicators are signaling the same price level as a potential support or resistance level.
For example, if a pivot point level lines up with a historical support level, this could be a strong indication that the price is likely to bounce off of that level. Conversely, if a pivot point level lines up with a historical resistance level, this could be a strong indication that the price is likely to break through that level.
Traders can also use pivot points to help identify potential entry and exit points for trades. For example, if the price is approaching a pivot point level and there is confluence with a support or resistance level, this could be a good time to enter a trade. Similarly, if the price has reached a pivot point level and there is confluence with a support or resistance level, this could be a good time to exit a trade.
Conclusion
Support and resistance levels and pivot points are popular technical analysis tools traders use to predict price movements in the financial markets. While both tools can be useful independently, they are even more powerful when used together.
Traders should be cautious not to rely on any single indicator or tool and should consider using a well-rounded approach that includes multiple technical indicators and fundamental analysis.
By combining pivot points and support and resistance levels, traders can identify potential entry and exit points for trades and increase their chances of market success.